# 飞行日志分析
This topic provide an overview of the tools and methods that can be used to analyze PX4 flight logs (more detailed topics are linked below in some cases).
注解
Flight Reporting explains how to download a log and report/discuss issues about a flight with the development team.
# 结构化分析
在分析飞行日志之前,重要的是建立它的上下文:
- 如果分析是在故障发生之后进行的,那么日志是捕捉到了这次故障还是在半空中停止了记录呢?
- 所有的控制器都跟踪到了它的设定值吗? 最简单的方法是将的横滚和俯仰的角速度与它们的设定值进行比较。
- 传感器数据看起来有效吗? Was there very strong vibration (a reasonable threshold for strong vibration is anything with a peak-to-peak of more than 2-3 m/s/s).
- If the root cause is not specific to the vehicle make sure to report it with a link to the log file (and video if one exists) on the PX4 issue tracker (opens new window).
# 排除电力故障
If a log file ends mid-air, two main causes are possible: a power failure or a hard fault of the operating system.
On autopilots based on the STM32 series (opens new window), hard faults are logged to the SD card. These are located on the top level of the SD card and named fault_date.log, e.g. fault_2017_04_03_00_26_05.log. You should check for the presence of this file if a flight log ends abruptly.
# 分析工具
# Flight Review(在线工具)
Flight Review (opens new window) is the successor of Log Muncher. 他能与新的 ULog 日志格式结合使用。
主要特性:
- 基于 web,非常适合终端用户。
- Users can upload logs through the web interface, and then share report with others (bulk upload is supported using the upload_log.py (opens new window) script)
- 交互式绘图。
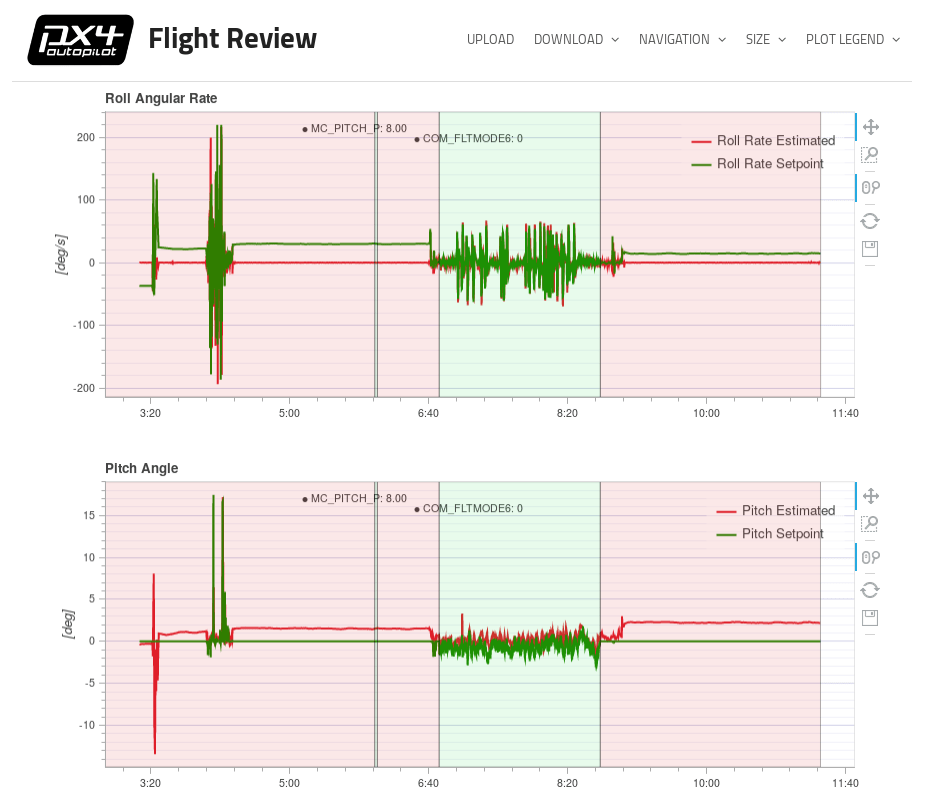
See Log Analysis using Flight Review for an introduction.
# PlotJugler
PlotJuggler (opens new window) is a desktop application that allows users to easily visualize and analyze data expressed in the form of time series. This is one of the best ULog analysis tools as it exposes all information in the log (Flight Review, by comparison, only shows a small subset of the data).
It supports ULog files (.ulg) since version 2.1.4.
主要特性:
- Intuitive drag & drop interface.
- 可以将数据安排在多个图表、选项卡或窗口中。
- All uORB topics are shown and can be graphed.
- 整理好数据后,将其保存到“布局”文件中,这样支持多次重新加载。
- Process your data inside PlotJuggler itself, using custom "data transformations".
Source code and downloads are available on Github (opens new window).
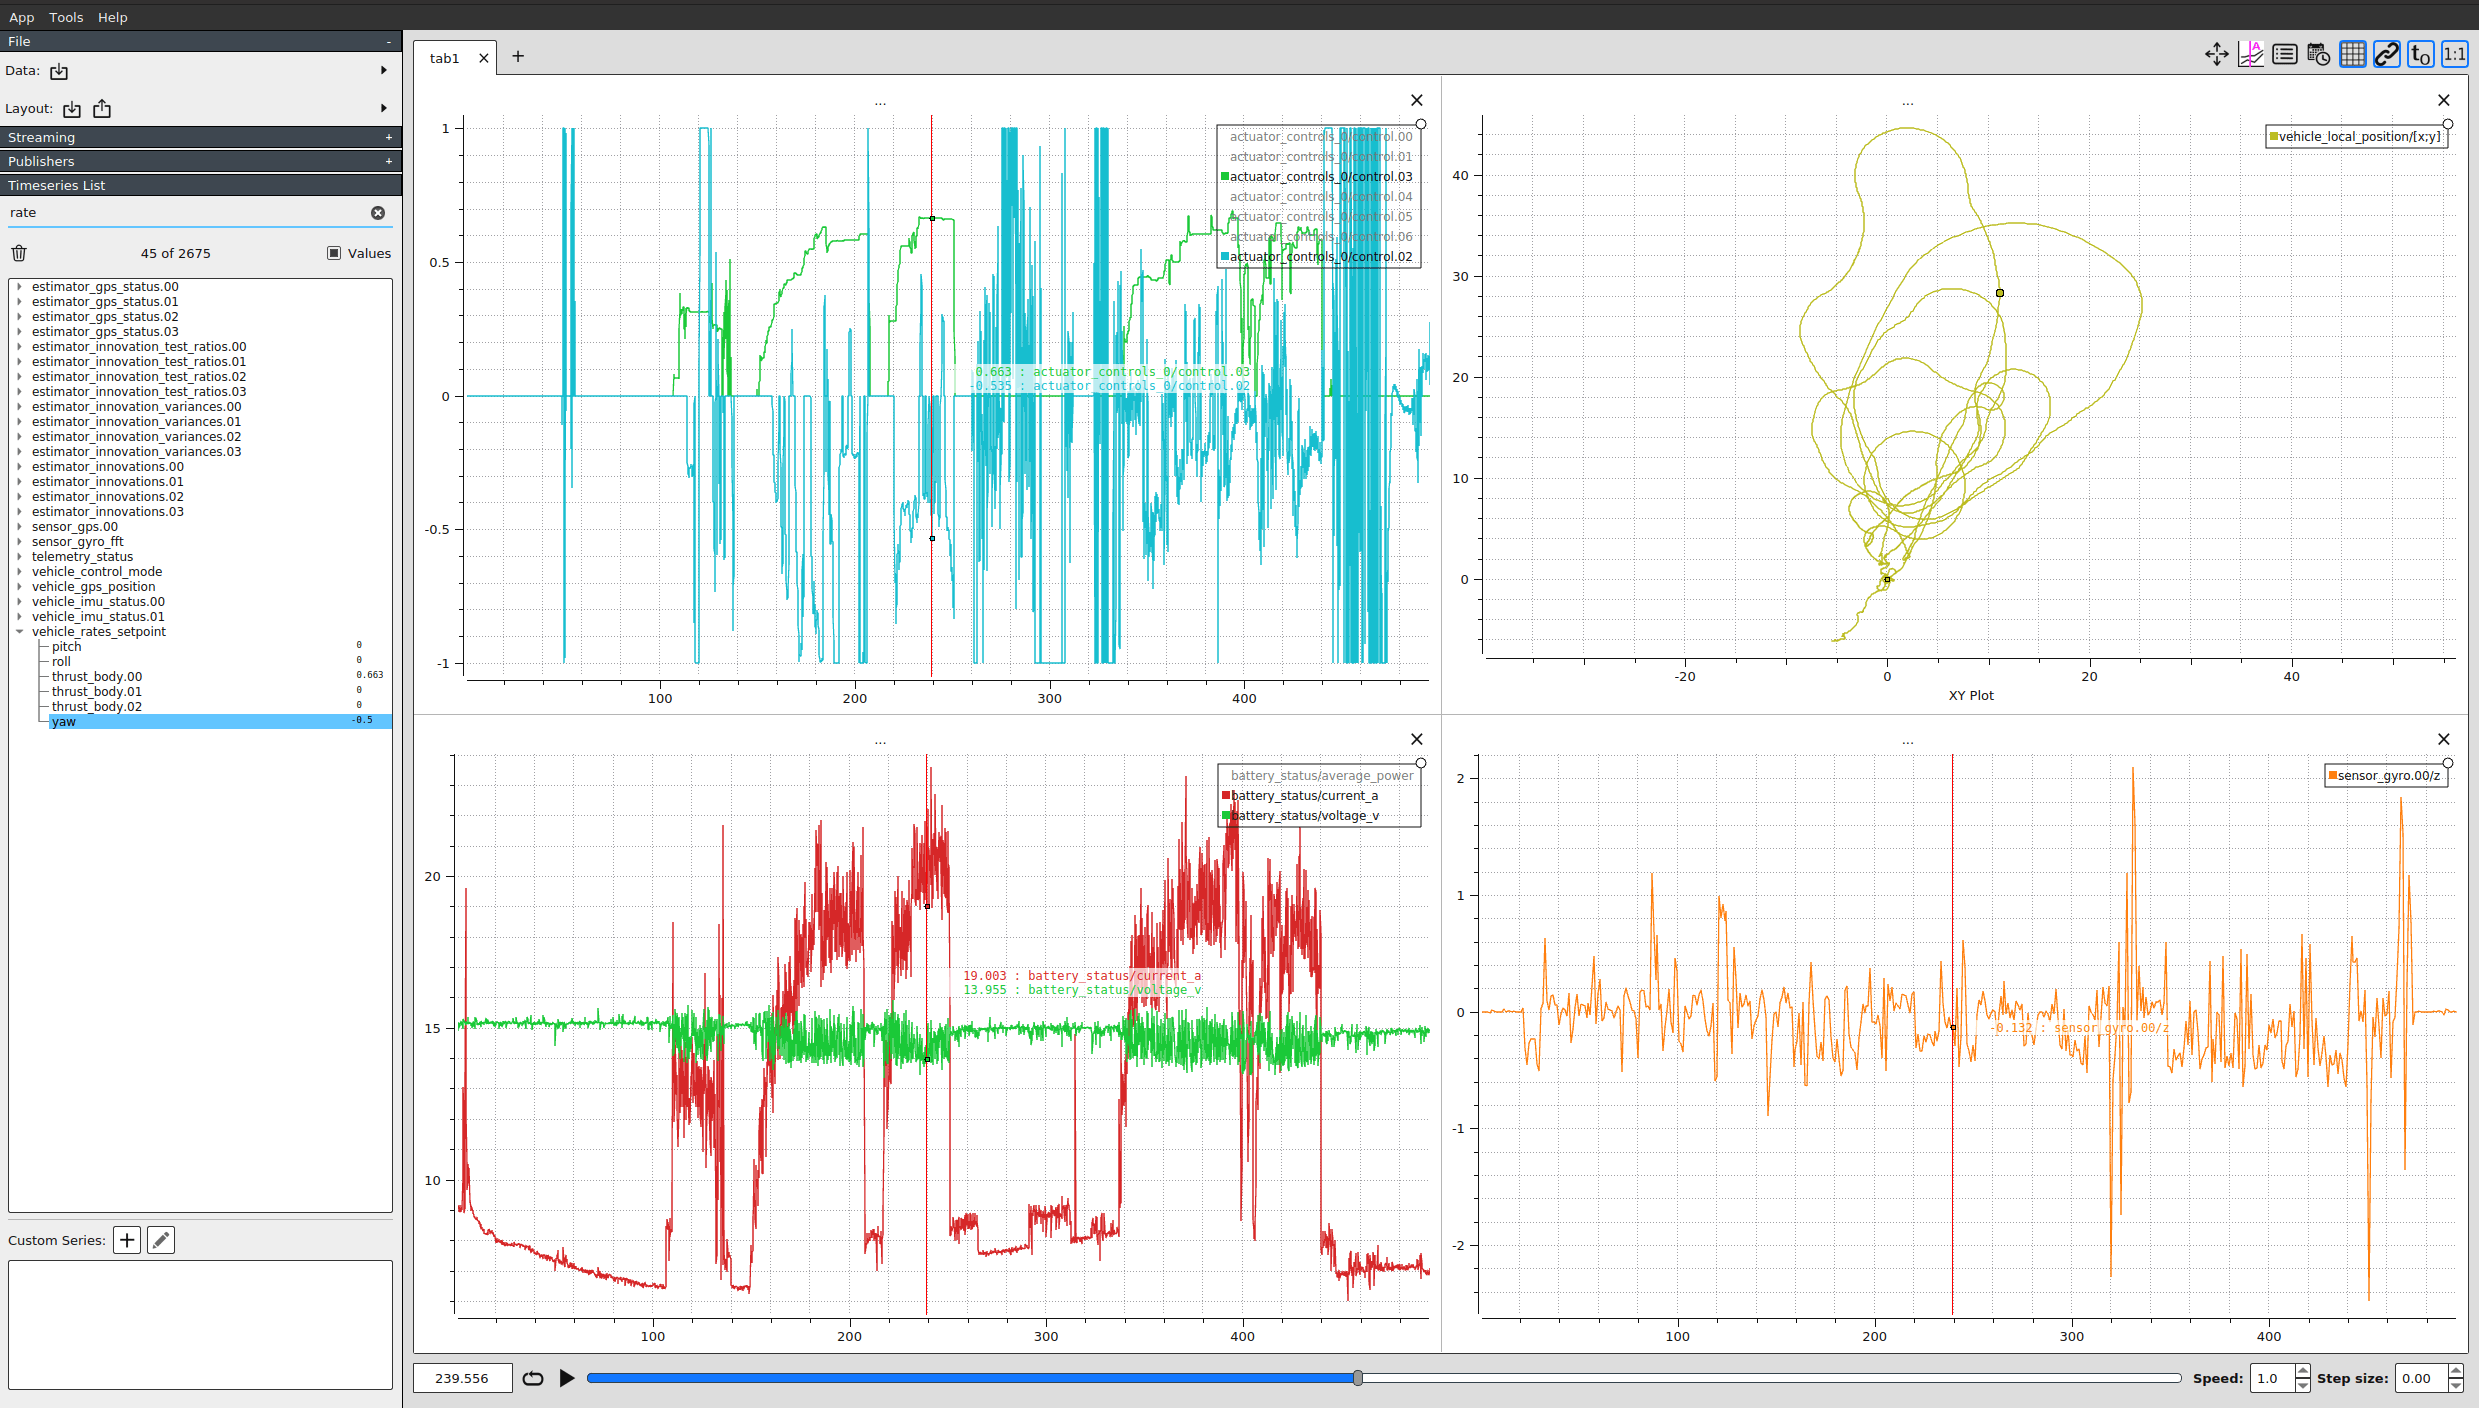
See Log Analysis using Plot Juggler for an introduction.
# pyulog
pyulog (opens new window) 是用于分析 ulog 文件的 python 包,以及一组用于提取/显示 ulog 信息并转换为其他文件格式的命令行脚本。
主要特性:
- 用于分析 ulog 文件的 python 库。 许多其他 ULog 分析和可视化工具使用的基本库。
- 提取/显示 ulog 信息的脚本:
- ulog_info: display information from an ULog file.
- ulog_messages: display logged messages from an ULog file.
- ulog_params: extract parameters from an ULog file.
- 转换 ulog 文件为其他格式的脚本:
- ulog2csv: convert ULog to (several) CSV files.
- ulog2kml: convert ULog to (several) KML files.
所有脚本都作为系统范围的应用程序安装 (例如,在命令行上调用它们-前提是安装了 Python),并支持 -h 标志来获取使用说明。 例如:
$ ulog_info -h
usage: ulog_info [-h] [-v] file.ulg

Display information from an ULog file

positional arguments:
  file.ulg       ULog 输入文件

optional arguments:
  -h, --help     显示这个帮助信息然后退出
  -v, --verbose  详细输出
Below we see the kind of information exported from a sample file using ulog_info.
$ ulog_info sample.ulg
Logging start time: 0:01:52, duration: 0:01:08
Dropouts: count: 4, total duration: 0.1 s, max: 62 ms, mean: 29 ms
Info Messages:
 sys_name: PX4
 time_ref_utc: 0
 ver_hw: AUAV_X21
 ver_sw: fd483321a5cf50ead91164356d15aa474643aa73

Name (multi id, message size in bytes)    number of data points, total bytes
 actuator_controls_0 (0, 48)                 3269     156912
 actuator_outputs (0, 76)                    1311      99636
 commander_state (0, 9)                       678       6102
 control_state (0, 122)                      3268     398696
 cpuload (0, 16)                               69       1104
 ekf2_innovations (0, 140)                   3271     457940
 estimator_status (0, 309)                   1311     405099
 sensor_combined (0, 72)                    17070    1229040
 sensor_preflight (0, 16)                   17072     273152
 telemetry_status (0, 36)                      70       2520
 vehicle_attitude (0, 36)                    6461     232596
 vehicle_attitude_setpoint (0, 55)           3272     179960
 vehicle_local_position (0, 123)              678      83394
 vehicle_rates_setpoint (0, 24)              6448     154752
 vehicle_status (0, 45)                       294      13230
# FlightPlot
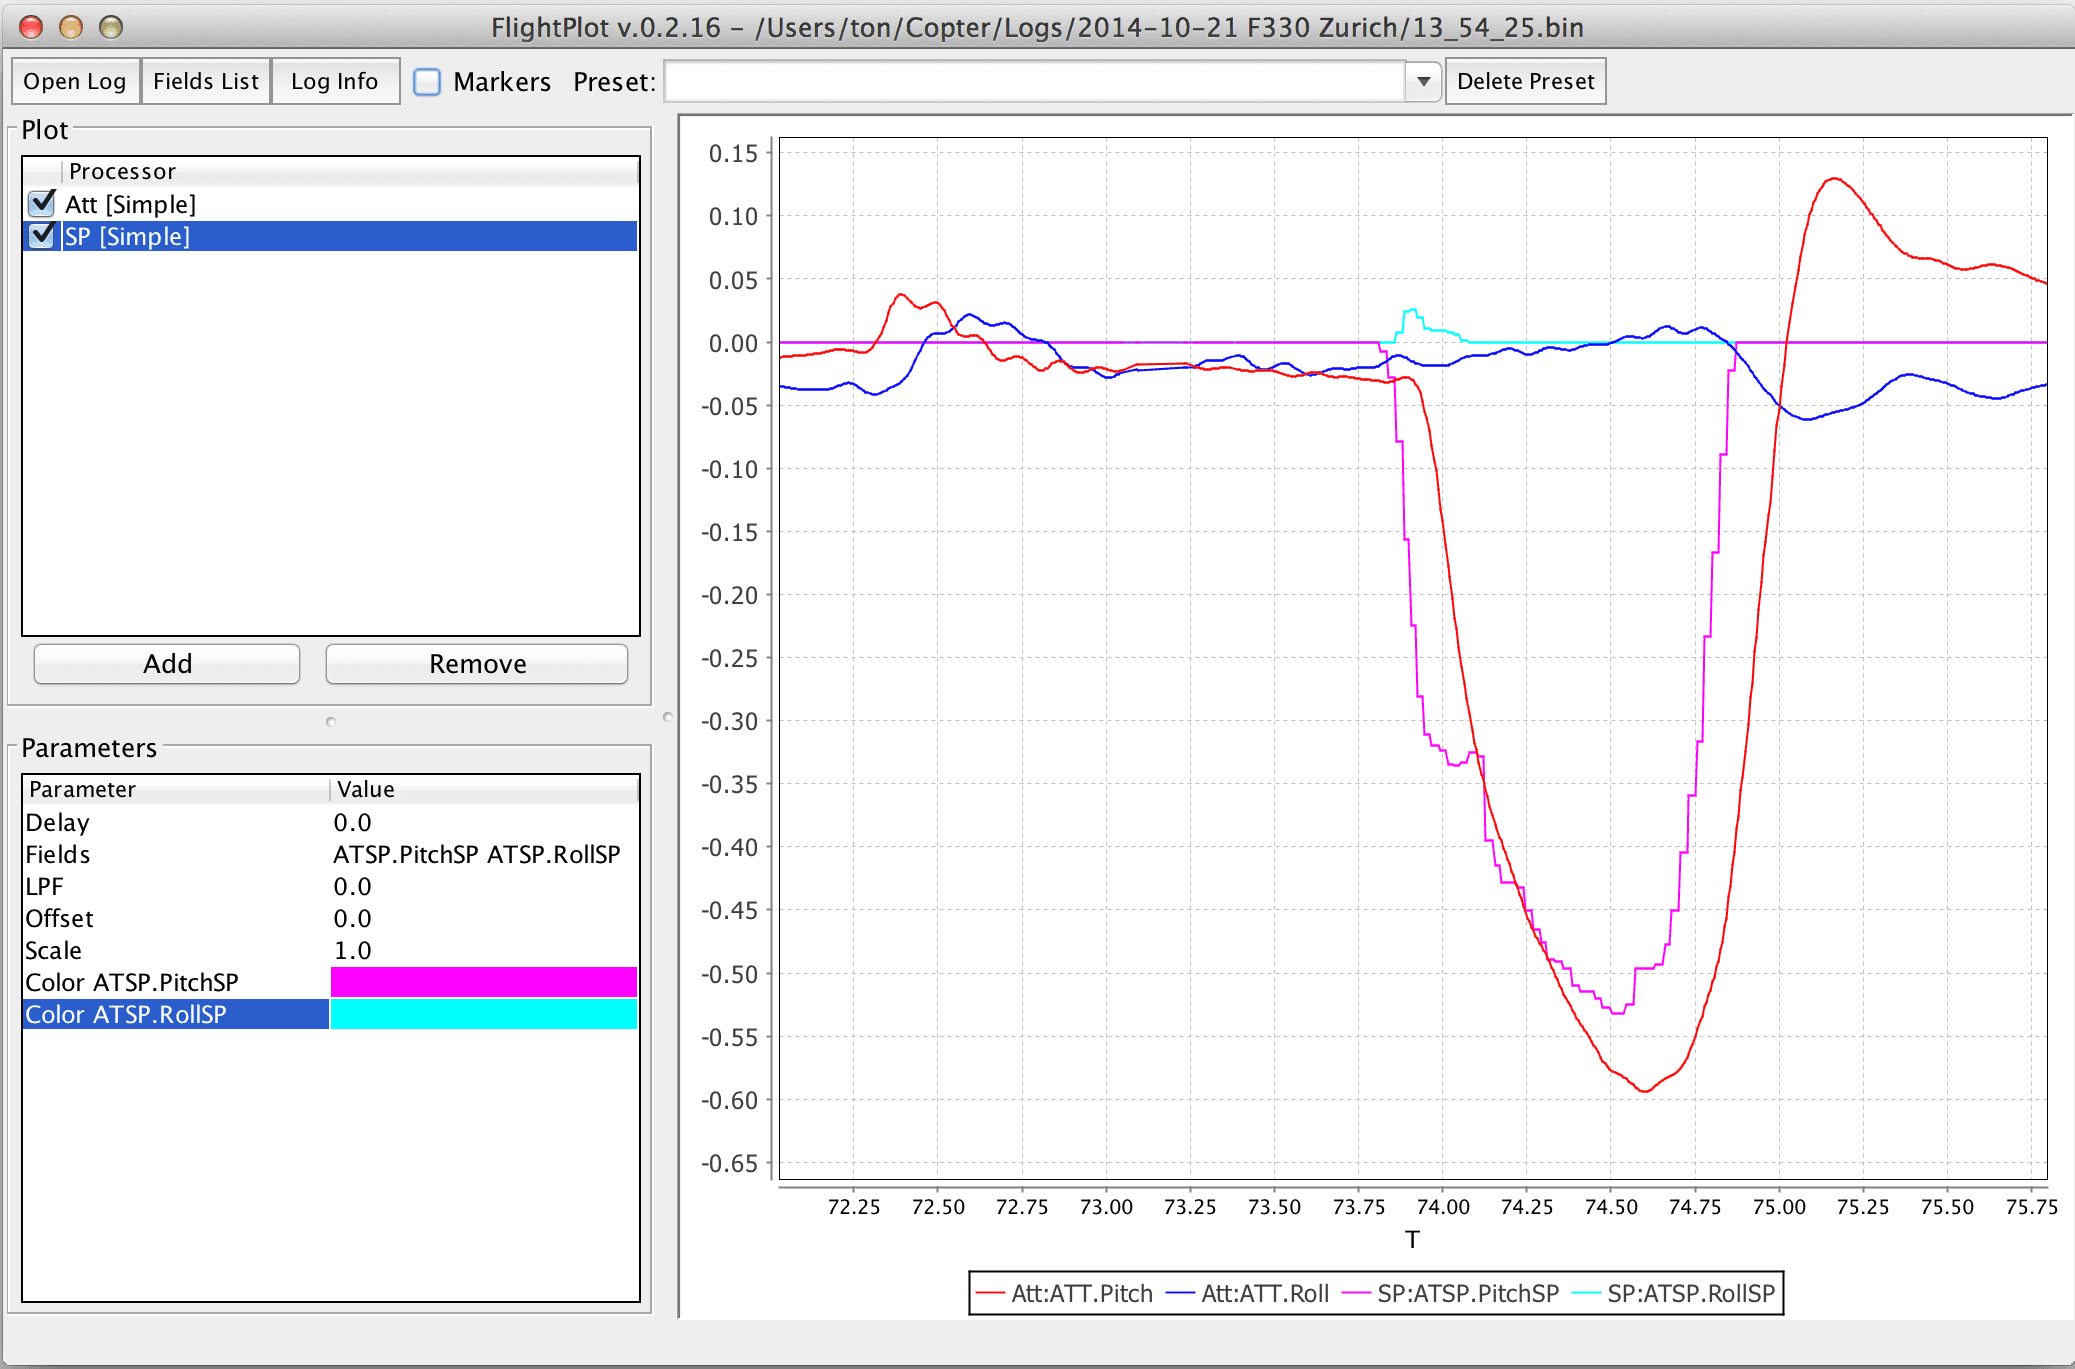
FlightPlot (opens new window) is a desktop based tool for log analysis. It can be downloaded from FlightPlot Downloads (opens new window) (Linux, MacOS, Windows).
主要特性:
- 基于 Java 的,跨平台的
- 直观的图形用户界面,不需要编程知识
- 支持新的和旧的 PX4 日志格式 (比如 .px4log,.ulg,.bin)
- 允许保存图形为图像
# PX4Tools
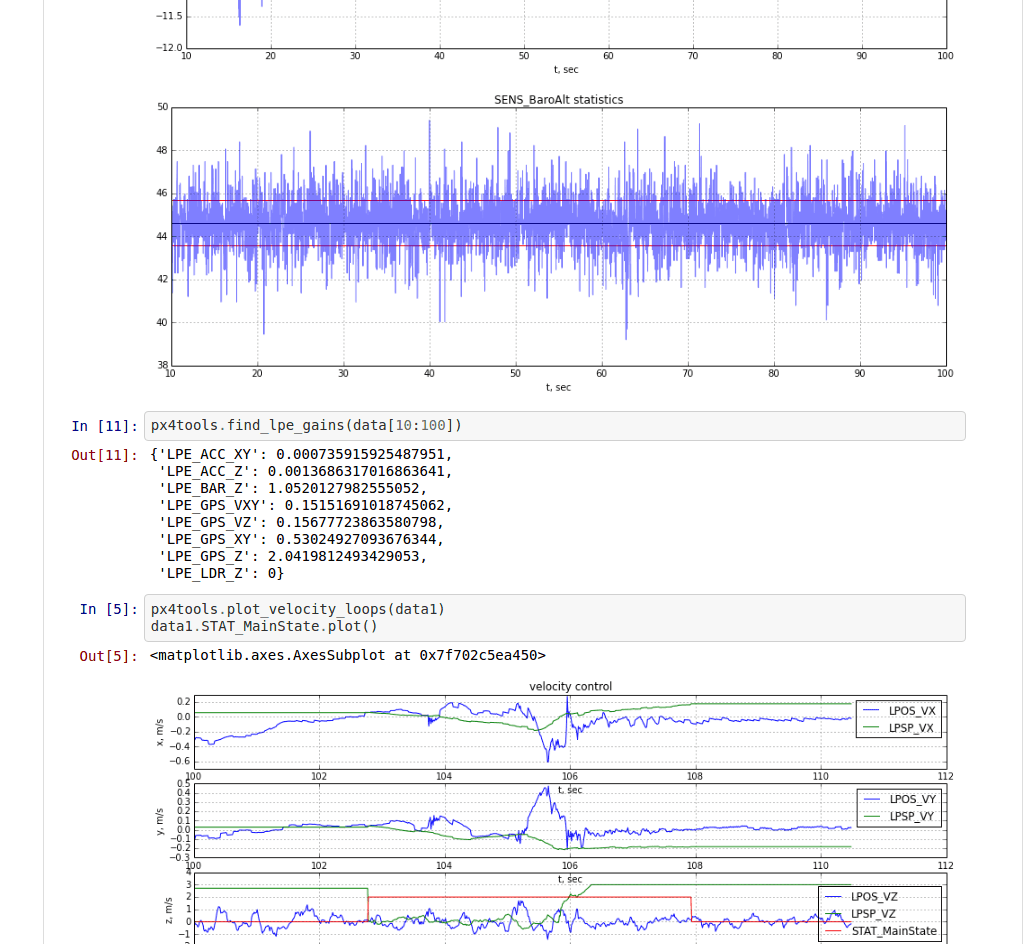
PX4Tools (opens new window) is a log analysis toolbox for the PX4 autopilot written in Python. The recommended installation procedure is to use anaconda3 (opens new window). See px4tools github page (opens new window) for details.
主要特性:
- Easy to share, users can view notebooks on Github (e.g. 15-09-30 Kabir Log.ipynb (opens new window))
- Python based, cross platform, works with anaconda 2 and anaconda3
- 使用 iPython/jupyter notebooks 可以方便地共享分析
- 高级绘图功能,允许进行详细分析
# MAVGCL
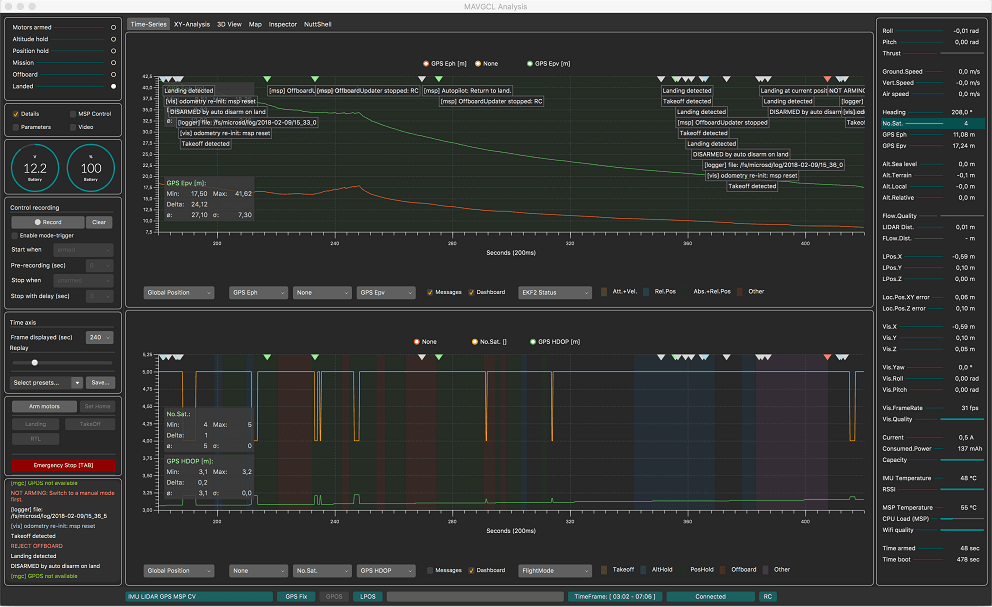
MAVGCL (opens new window) is an in-flight log analyzer for PX4. It can also be used in offline mode with downloaded uLog files.
主要特性:
- 基于 MAVLink 消息或 MAVLink 上 ULOG 数据的实时数据采集( 50 ms 采样,100 ms 滚动显示)
- 由消息( MAVLink 和 ULog) 和参数更改(仅 MAVLink) 注释的时间图
- 选定的关键指标的 XY 分析
- 3D 视图 (飞行器和观察者视角)
- MAVLink inspector 面板(报告原始 MAVLink 消息)
- 离线模式:从 PX4Log/ULog 导入关键指标(通过 WiFi 从设备上获取文件或最后一次日志)
- 基于 Java 在 MacOS 和 Ubuntu 上运行。
- 更多……
# Data Comets
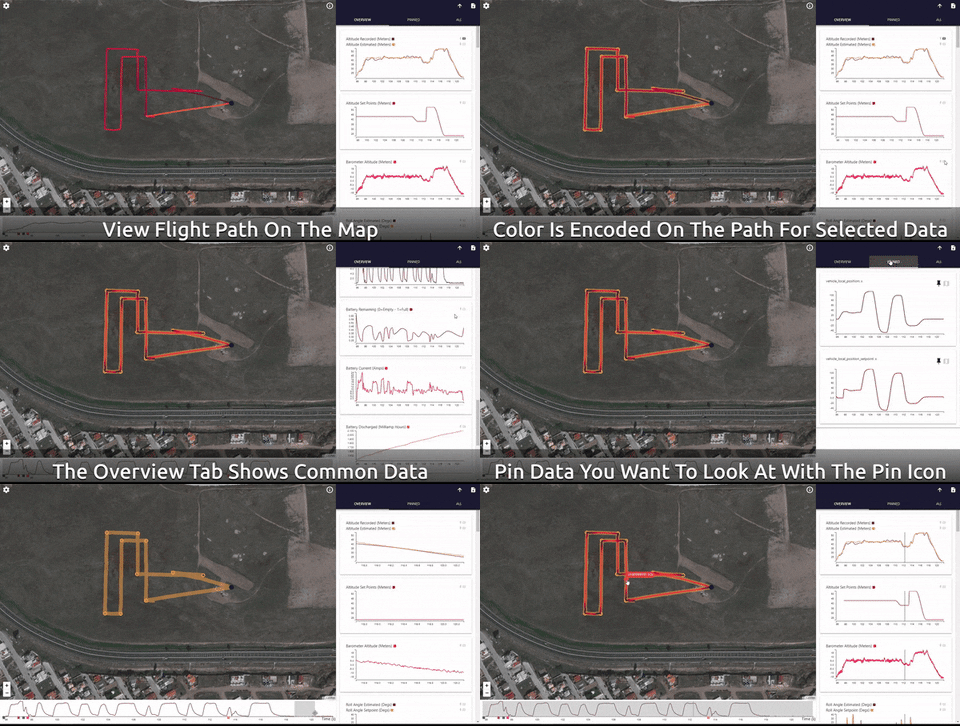
Data Comets (opens new window) is a interactive PX4 flight log analysis tool that allows you to encode flight data onto the flight path, filter and brush the data by time - and much more!
You can use the online version of the tool for small log files (< 32Mb), or run it locally in order to analyze longer flights.
