# Debugging with Eclipse and J-Link
This topic explains how to setup and use MCU Eclipse (opens new window) with a Segger Jlink adapter to debug PX4 running on NuttX (e.g. Pixhawk series boards).
# Required Hardware
- J-Link EDU Mini (opens new window)
- Adapter to connect Segger JLink to Flight Controller SWD Debug Port (debug port).
- Micro USB cable
# Installation
# PX4
Setup PX4 by following the normal guidelines:
- Setup the PX4 Developer Environment/Toolchain for your platform (e.g. for Linux see: Development Environment on Ubuntu LTS / Debian Linux).
- Download PX4 and optionally build it on the command line.
# Eclipse
To install Eclipse:
- Download Eclipse CDT for C/C++ Developers (opens new window) (MCU GitHub).
- Extract the Eclipse folder and copy it anywhere (there is no need to run any install scripts).
- Run Eclipse and choose a location for your initial workbench.
# Segger Jlink Tools
To install the Segger Jlink tools:
- Download and run the J-Link Software and Documentation Pack (opens new window) for your OS (Windows and Linux packages available).
- On Linux the tools are installed in /usr/bin.
For more information, see: https://gnu-mcu-eclipse.github.io/debug/jlink/install/ (opens new window).
# First Use
Connect the Segger JLink to the host computer and the flight controller debug port (via an adapter).
Power the flight controller.
Run Eclipse.
Add a source by choosing File > Import > C/C++ > Existing Code as Makefile Project and click Next.
Point it to the PX4-Autopilot folder and give it a name, then select ARM Cross GCC in the Toolchain for Indexer Settings and click Finish. Import takes a while, wait for it to complete.
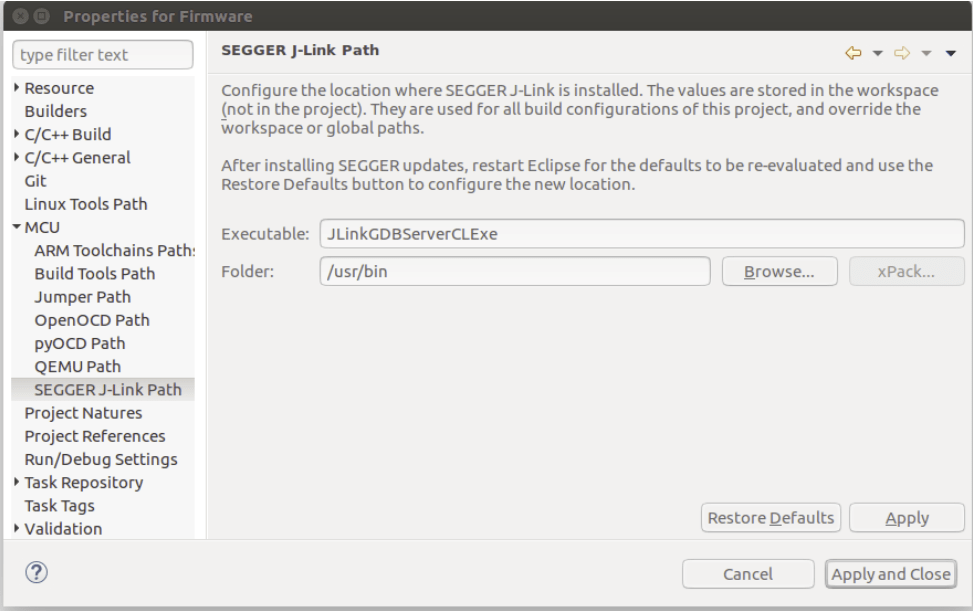
Set the MCU settings: right-click on the top-level project in the Project Explorer, select Properties then under MCU choose SEGGER J-Link Path. Set it as shown in the screenshot below.
Update packs:
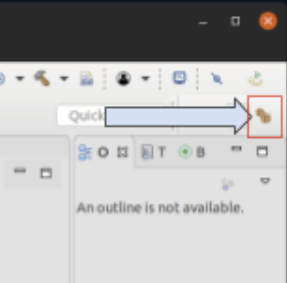
Click the small icon on the top right called Open Perspective and open the Packs perspective.
Click the update all button.
TIP
This takes a VERY LONG TIME (10 minutes). Ignore all the errors about missing packages that pop up.
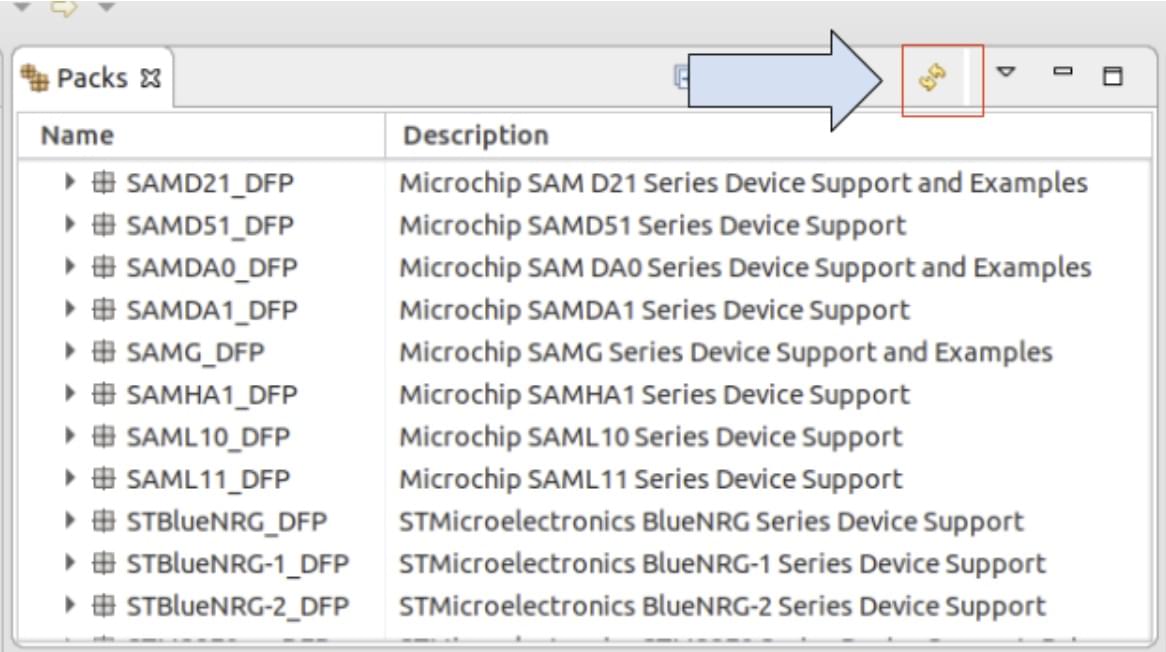
The STM32Fxx devices are found in the Keil folder, install by right-clicking and then selecting install on the according device for F4 and F7.
Setup debug configuration for target:
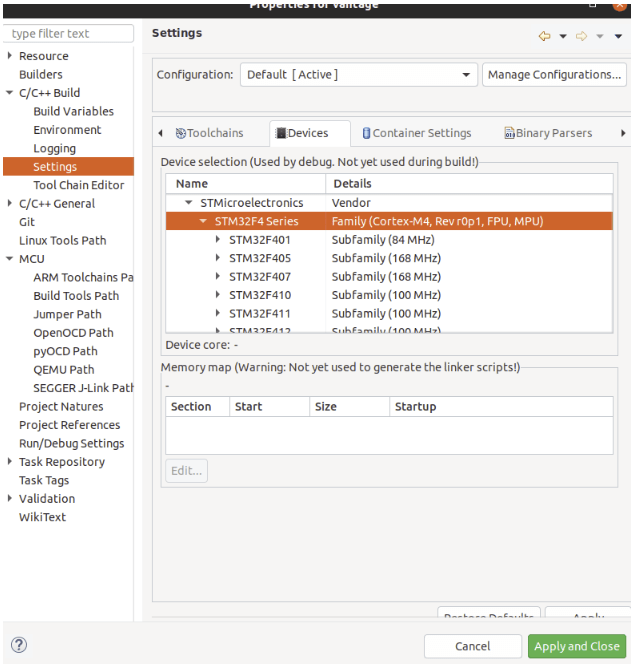
- Right click project and open the Settings (menu: C/C++ Build > Settings)
- Choose the Devices Tab, Devices section (Not Boards).
- Find the FMU chip you wish to debug.
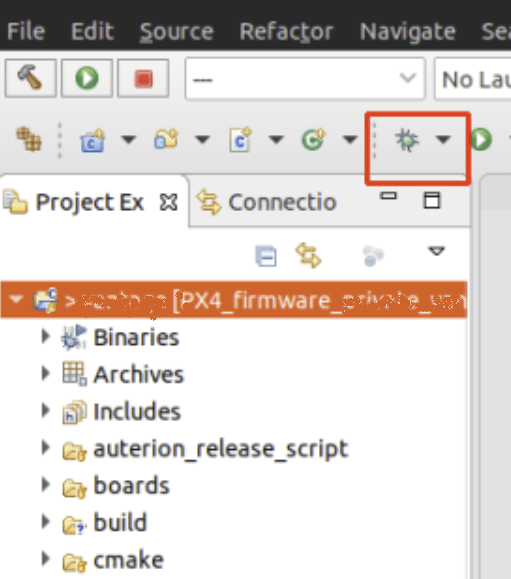
Select debug configurations with the small drop-down next to the bug symbol:
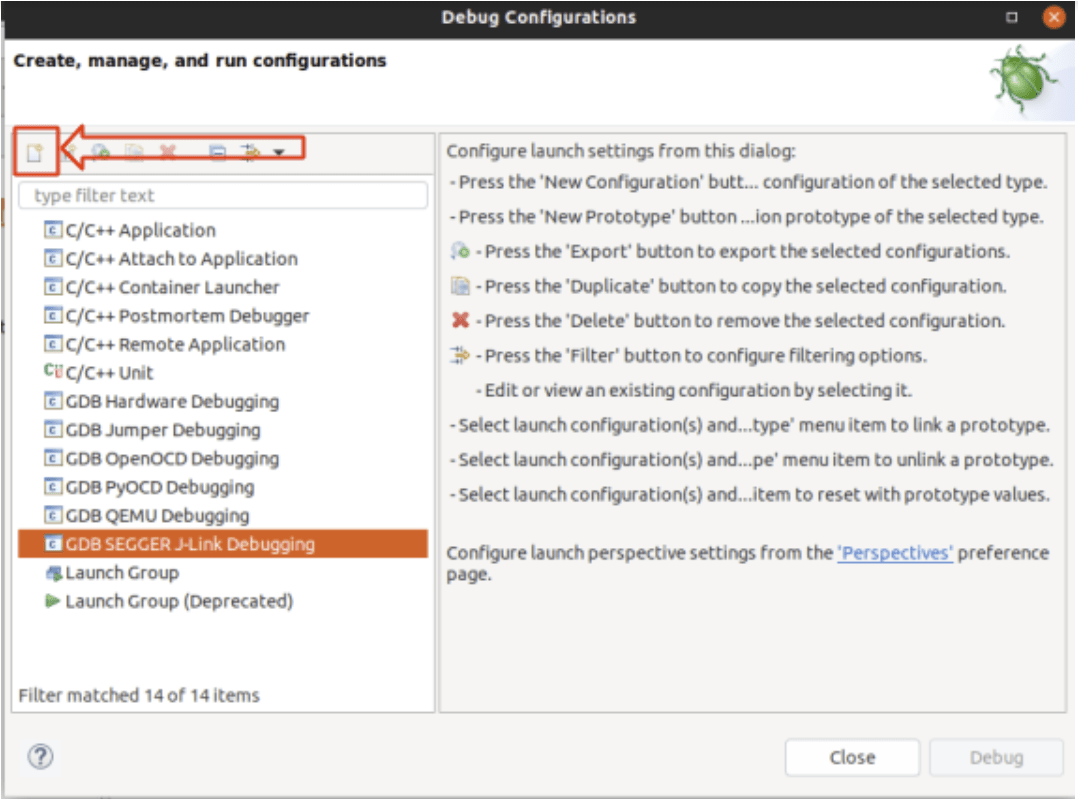
Then select GDB SEGGER J-Link Debugging and then the New config button on the top left.
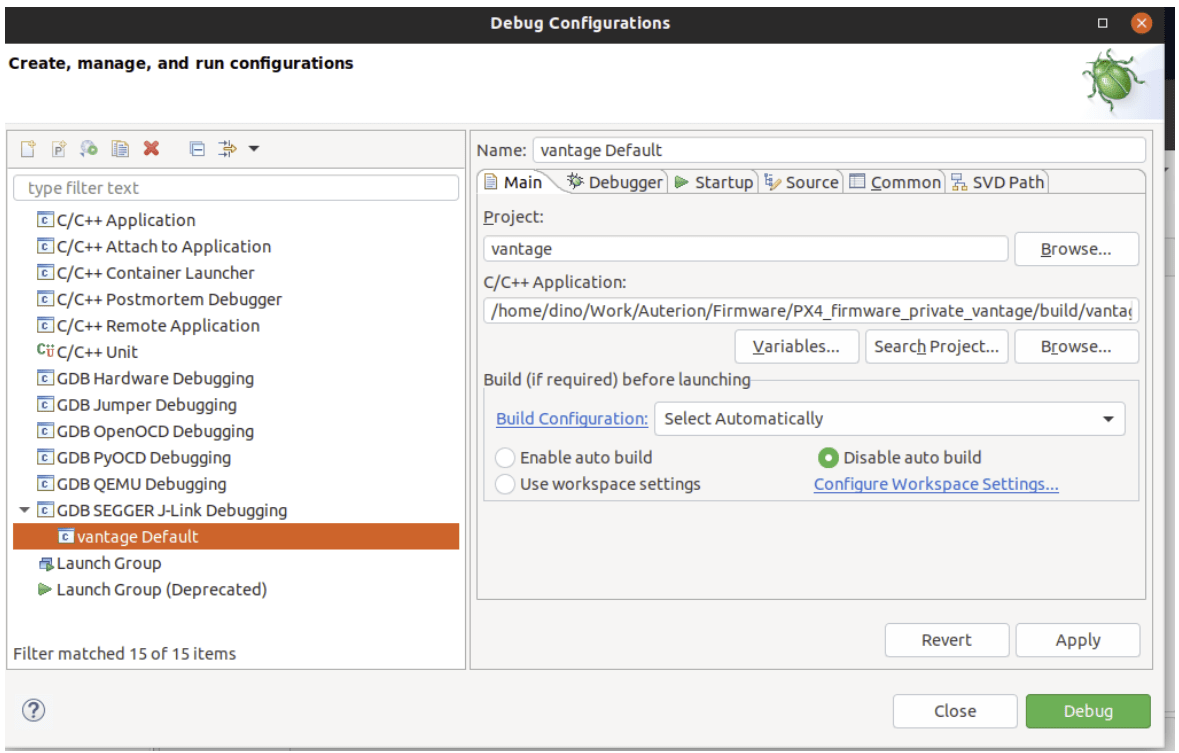
Setup build config:
- Give it a name and set the C/C++ Application to the corresponding .elf file.
- Choose Disable Auto build
Note
Remember that you must build the target from the command line before starting a debug session.
The Debugger and Startup tabs shouldn’t need any modifications (just verify your settings with the screenshots below)
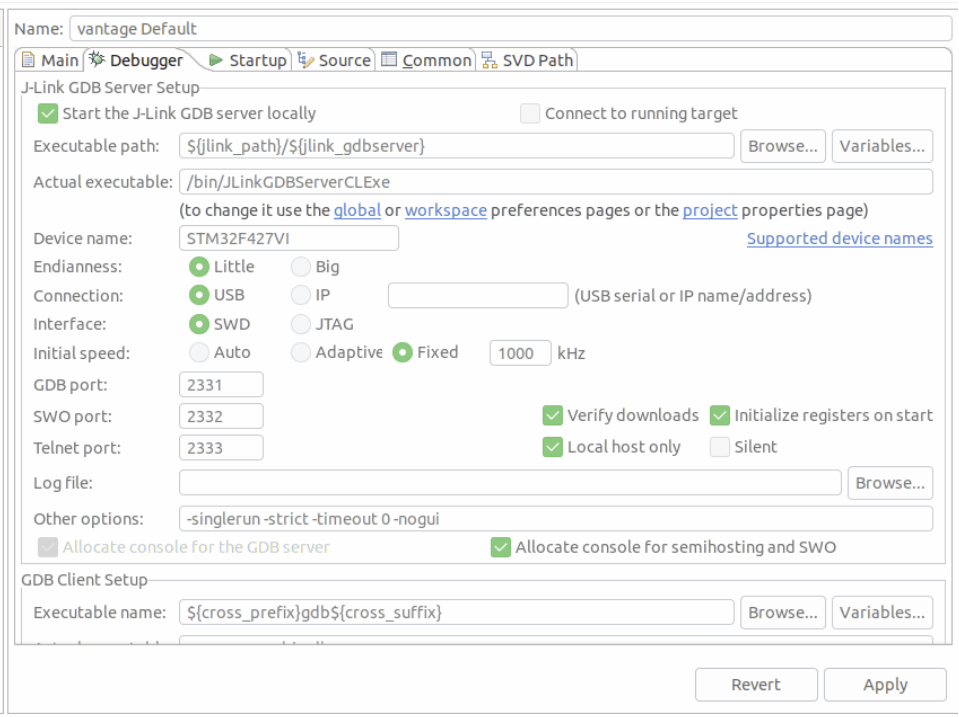
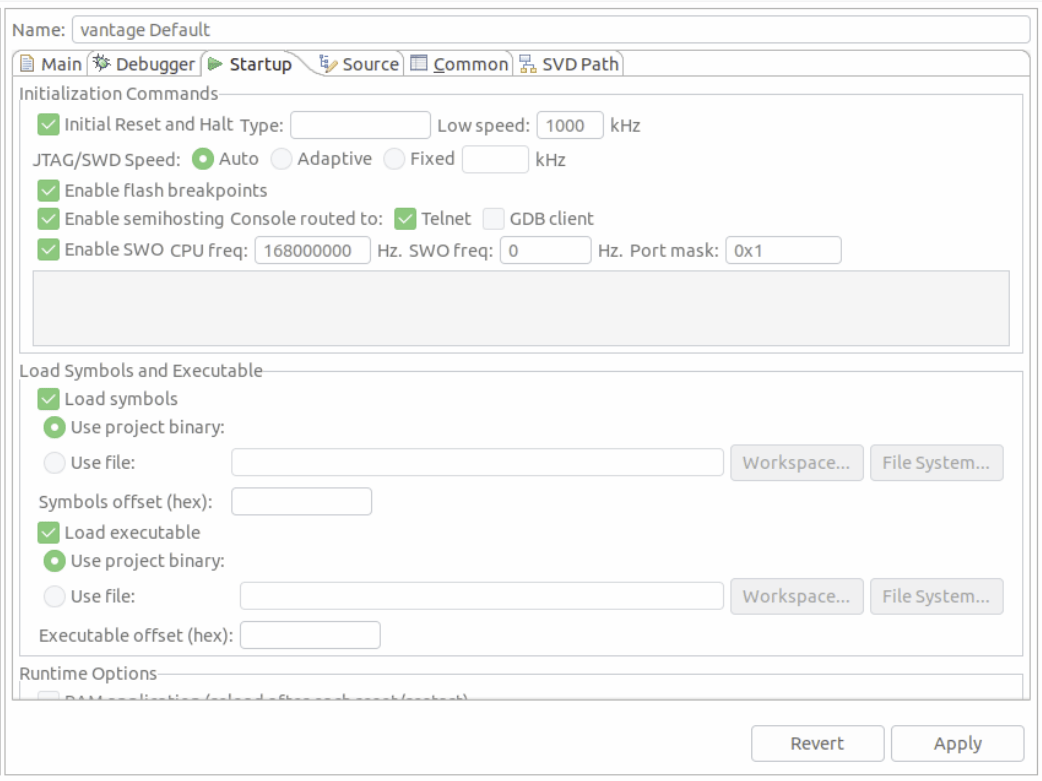
# SEGGER Task-aware debugging
Task-aware debugging (also known as thread-aware debugging (opens new window)) allows you to show the context of all running threads/tasks instead of just the stack current task. This is quite useful since PX4 tends to run many different tasks.
To enable this feature for use in Eclipse:
You first need to enable
CONFIG_DEBUG_TCBINFOin the NuttX configuration for your build (to expose the TCB offsets).- Open a terminal in the root of your PX4-Autopilot source code
- In the terminal, open
menuconfigusing the appropriate make target for the build. This will be something like:(See PX4 Menuconfig Setup for more information) on using the config tools).make px4_fmu-v5_default boardguiconfig - Ensure that the Enable TCBinfo struct for debug is selected as shown:
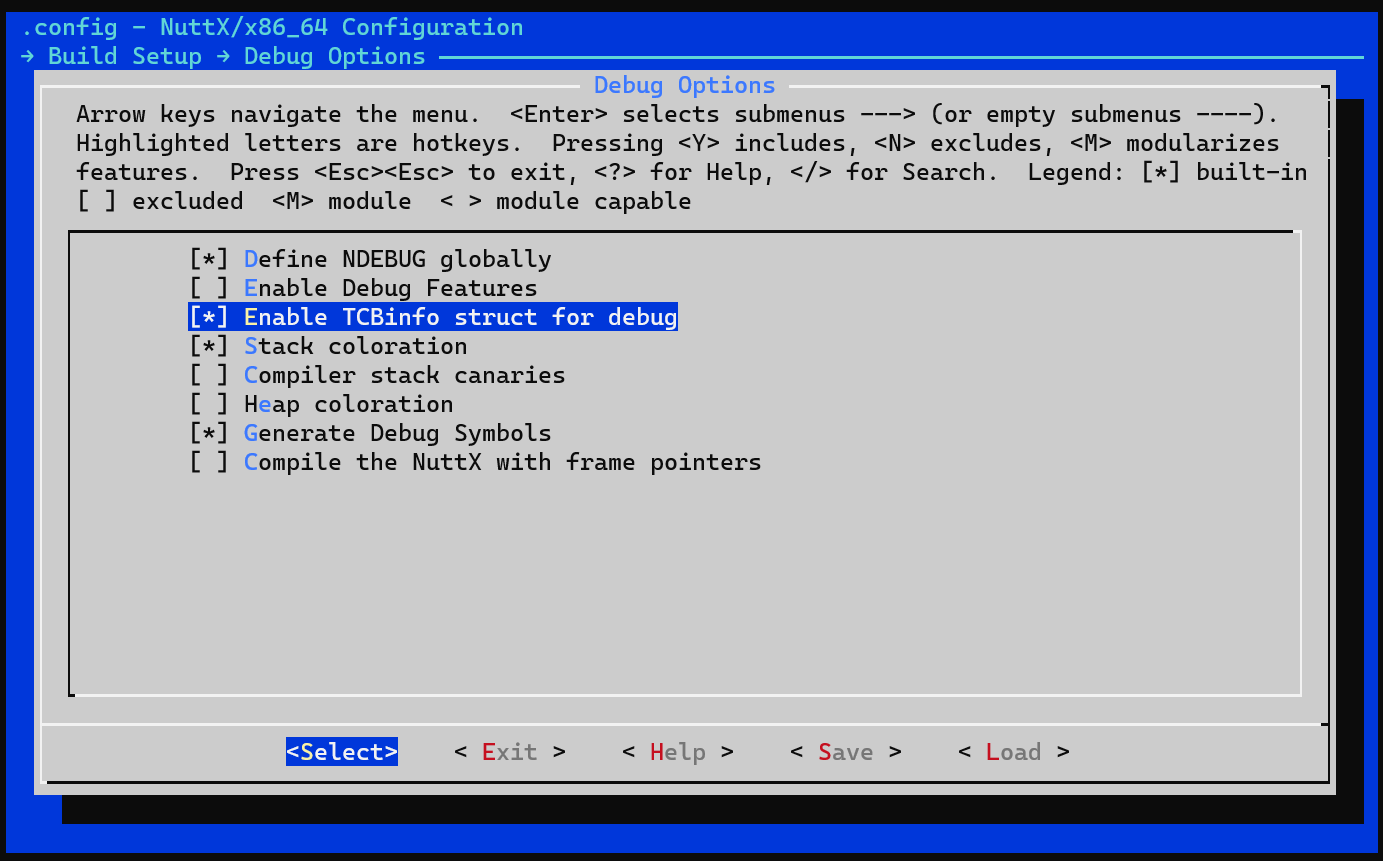
Compile the jlink-nuttx.so library in the terminal by running the following command in the terminal:
make jlink-nuttxModify Eclipse to use this libary. In the J-Link GDB Server Setup configuration, update Other options to include
-rtos /home/<PX4 path>/Tools/jlink-nuttx.so, as shown in the image below.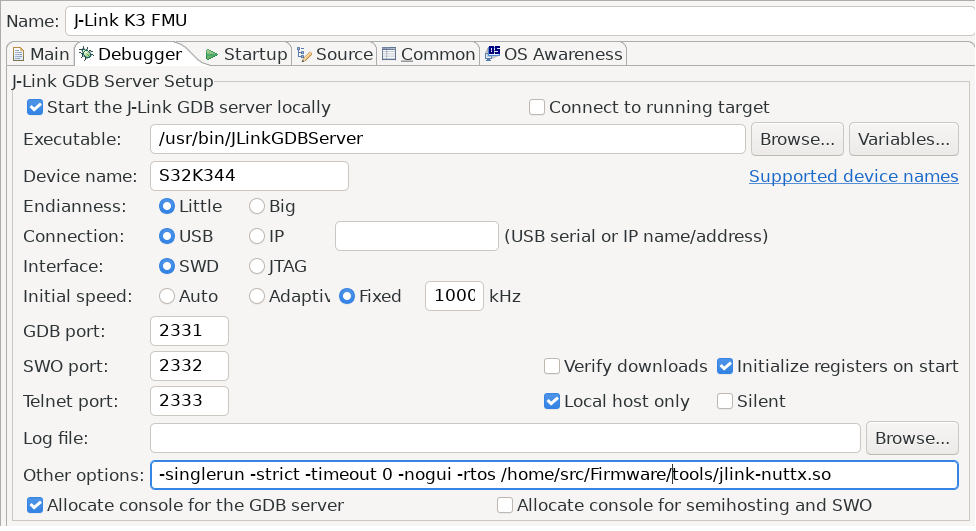
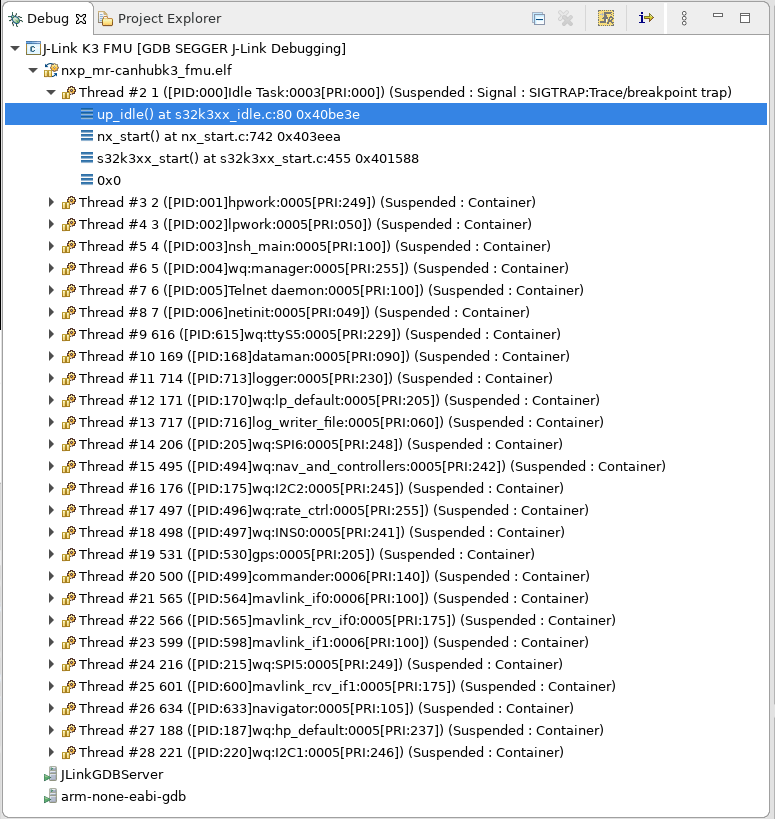
When running the debugger you should see now multiple threads instead of just one:
# Troubleshooting
# Target CPU not in Package Manager
If the target CPU does not appear in the package manager you may need these steps to get the register view working.
TIP
This should not generally happen (but anecdotally has been reported when connecting to an STM F7 controller).
Adding missing SVD files for the Peripheral View:
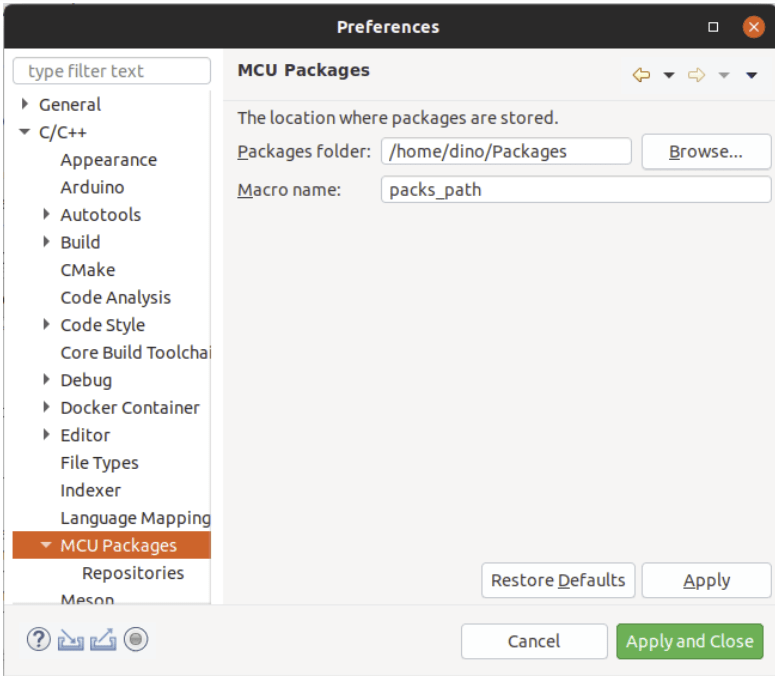
- Find out where MCU Eclipse stores its packages (Preferences > C/C++ > MCU Packages):
- Download missing packages from: http://www.keil.com/dd2/Pack/
- Open downloaded pack with a decompression tool, and extract the .SVD files from: /CMSIS/SVD.
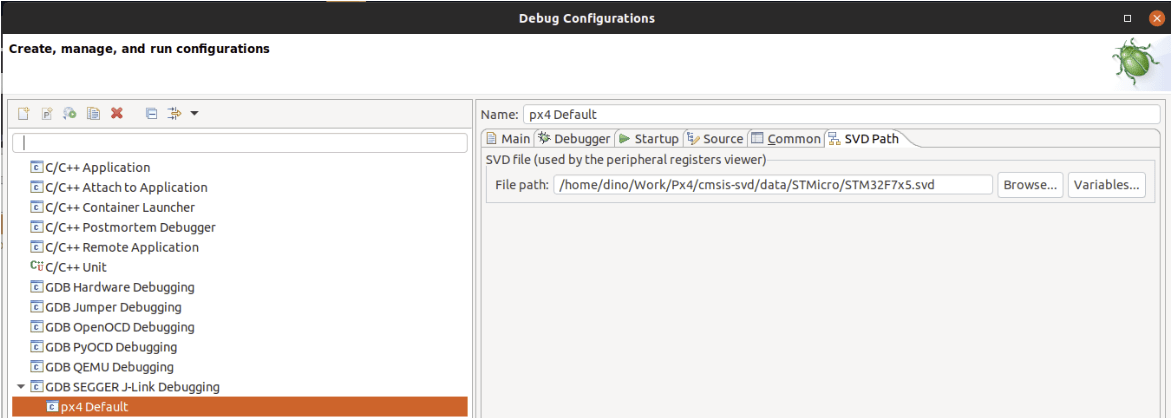
- Select desired .SVD file in: Debug Options > GDB SEGGER JLink Debugging > SVD Path
