Visual Studio Code IDE (VSCode)
Visual Studio Code is a powerful cross-platform source code editor/IDE that can be used for PX4 development on Ubuntu, Windows, and macOS.
There are a number of reasons to use VSCode for PX4 development:
- Getting setup really only takes a few minutes.
- A rich extension ecosystem that enables a huge range of tools needed for PX4 development: C/C++ (with solid cmake integration), Python, Jinja2, ROS messages, and even DroneCAN DSDL.
- Excellent Github integration.
This topic explains how to setup the IDE and start developing.
INFO
There are other powerful IDEs, but they typically take more effort to integrate with PX4. With VScode, configuration is stored in the PX4/PX4-Autopilot tree (PX4-Autopilot/.vscode) so the setup process is as simple as adding the project folder.
Preconditions
You must already have installed the command line PX4 developer environment for your platform and downloaded the Firmware source code repo.
Installation & Setup
Download and install VSCode (you will be offered the correct version for your OS).
Open VSCode and add the PX4 source code:
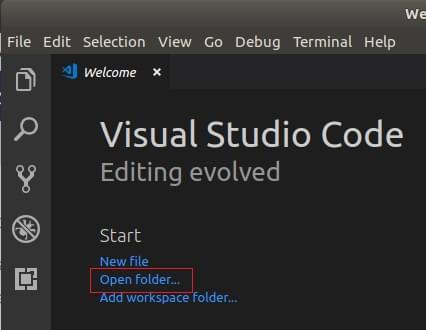
Select Open folder ... option on the welcome page (or using the menu: File > Open Folder):
A file selection dialog will appear. Select the PX4-Autopilot directory and then press OK.
The project files and configuration will then load into VSCode.
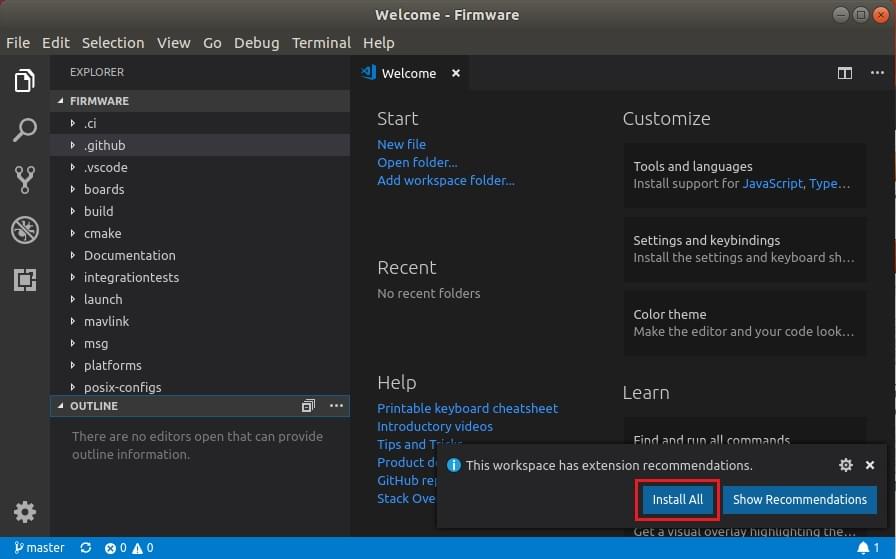
Press Install All on the This workspace has extension recommendations prompt (this will appear on the bottom right of the IDE).
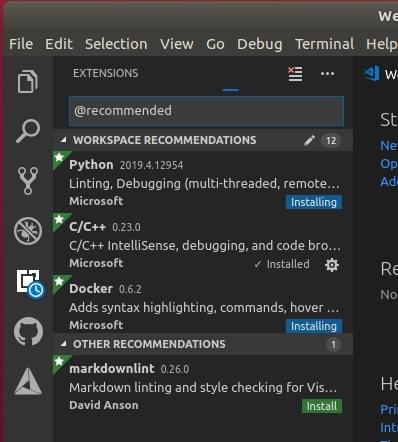
VSCode will open the Extensions panel on the left hand side so you can watch the progress of installation.
A number of notifications/prompts may appear in the bottom right corner
TIP
If the prompts disappear, click the little "alarm" icon on the right of the bottom blue bar.
- If prompted to install a new version of cmake:
- Say No (the right version is installed with the PX4 developer environment).
- If prompted to sign into github.com and add your credentials:
- This is up to you! It provides a deep integration between Github and the IDE, which may simplify your workflow.
- Other prompts are optional, and may be installed if they seem useful.
- If prompted to install a new version of cmake:
Building PX4
To build:
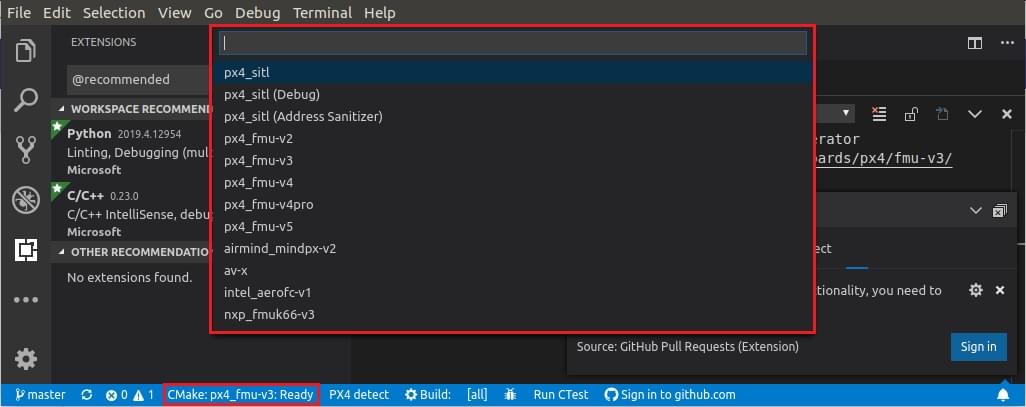
Select your build target ("cmake build config"):
The current cmake build target is shown on the blue config bar at the bottom (if this is already your desired target, skip to next step).
INFO
The cmake target you select affects the targets offered for when building/debugging (i.e. for hardware debugging you must select a hardware target like
px4_fmu-v6).Click the target on the config bar to display other options, and select the one you want (this will replace any selected target).
Cmake will then configure your project (see notification in bottom right).
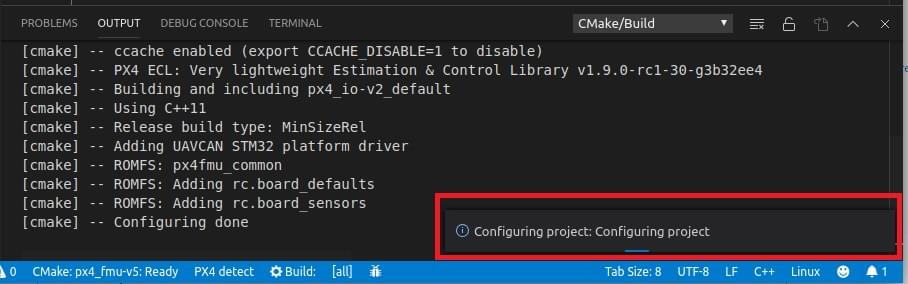
Wait until configuration completes. When this is done the notification will disappear and you'll be shown the build location:
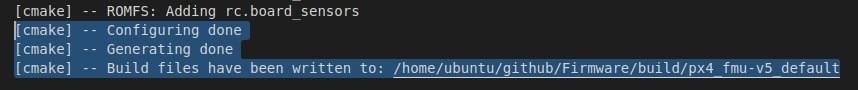 .
.
You can then kick off a build from the config bar (select either Build or Debug).

After building at least once you can now use [code completion](#code completion) and other VSCode features.
Debugging
SITL Debugging
To debug PX4 on SITL:
Select the debug icon on the sidebar (marked in red) to display the debug panel.
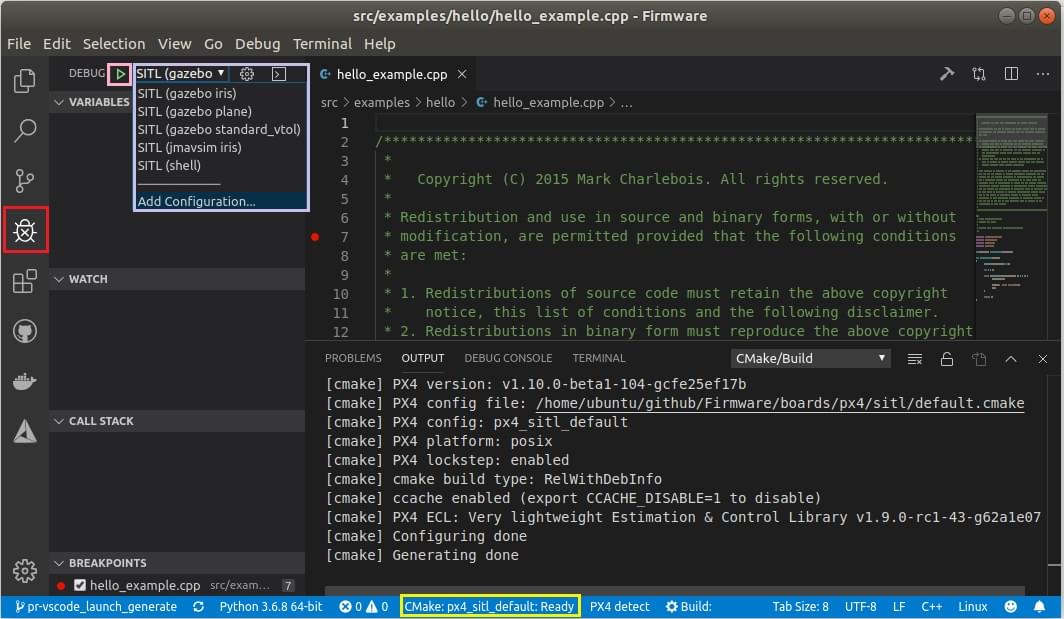
Then choose your debug target (e.g. Debug SITL (Gazebo Iris)) from the top bar debug dropdown (purple box).
INFO
The debug targets that are offered (purple box) match your build target (yellow box on the bottom bar). For example, to debug SITL targets, your build target must include SITL.
Start debugging by clicking the debug "play" arrow (next to the debug target in the top bar - pink box).
While debugging you can set breakpoints, step over code, and otherwise develop as normal.
Hardware Debugging
The instructions in SWD Debug Port explain how to connect to the SWD interface on common flight controllers (for example, using the Dronecode or Blackmagic probes).
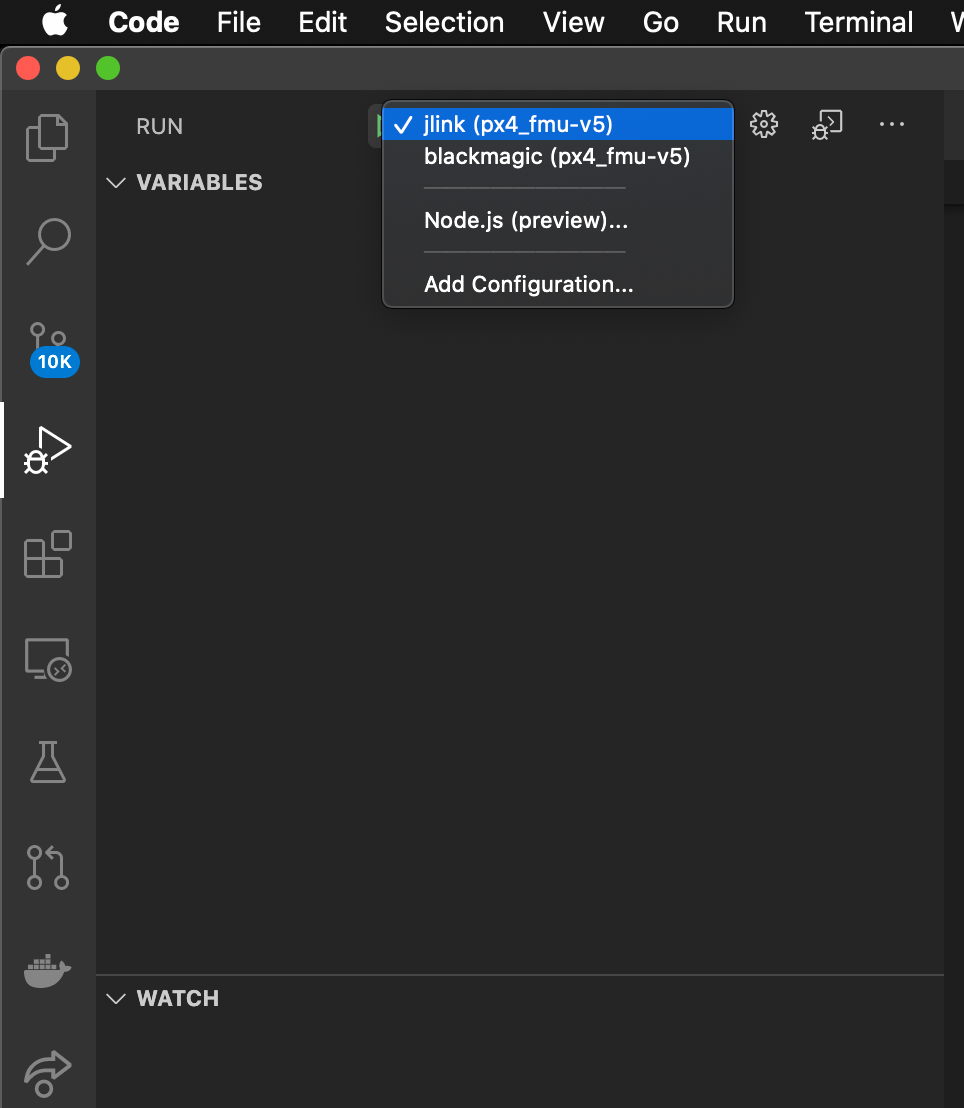
After connecting to the SWD interface, hardware debugging in VSCode is then the same as for SITL Debugging except that you select a debug target appropriate for your debugger type (and firmware) - e.g. jlink (px4_fmu-v5).
TIP
To see the jlink option you must have selected a cmake target for building firmware.
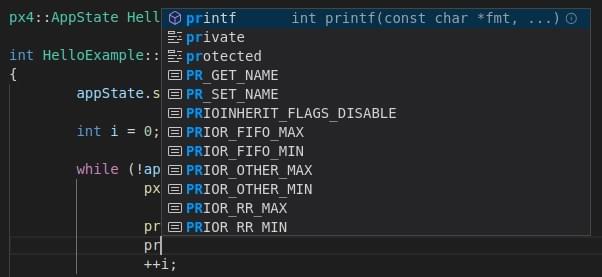
Code Completion
In order for the code completion to work (and other IntelliSense magic) you need an active configuration and to have built the code.
Once that is done you don't need to do anything else; the toolchain will automatically offer you symbols as you type.
Troubleshooting
This section includes guidance on setup and build errors.
"Visual Studio Code is unable to watch for file changes in this large workspace"
This error surfaces on startup. On some systems, there is an upper-limit on file handles imposed on applications, which means that VSCode might not be able to detect file modifications in /PX4-Autopilot.
You can increase this limit to avoid the error, at the expense of memory consumption. Follow the instructions here. A value of 65536 should be more than sufficient.