비행 로그 분석
This topic provide an overview of the tools and methods that can be used to analyze PX4 flight logs (more detailed topics are linked below in some cases).
INFO
Flight Reporting explains how to download a log and report/discuss issues about a flight with the development team.
구조 분석
비행 로그를 분석하기 전에 상황 파악이 더 중요합니다.
- 오작동 후 분석이 수행되면 로그에 충돌이 캡처 되었습니까 아니면 공중에서 중지 되었습니까?
- 모든 컨트롤러가 사건들을 추적 했습니까? 이를 설정하는 가장 쉬운 방법은 자세의 롤 및 피치 속도를 설정 포인트와 비교하는 것입니다.
- 센서 데이터가 유효합니까? Was there very strong vibration (a reasonable threshold for strong vibration is anything with a peak-to-peak of more than 2-3 m/s/s).
- If the root cause is not specific to the vehicle make sure to report it with a link to the log file (and video if one exists) on the PX4 issue tracker.
정전 방지
If a log file ends mid-air, two main causes are possible: a power failure or a hard fault of the operating system.
On autopilots based on the STM32 series, hard faults are logged to the SD card. These are located on the top level of the SD card and named fault_date.log, e.g. fault_2017_04_03_00_26_05.log. You should check for the presence of this file if a flight log ends abruptly.
분석 도구
Flight Review (온라인 도구)
Flight Review is the successor of Log Muncher. It is used in combination with the new ULog logging format.
주요 기능:
- 웹 기반으로 되어 있어며, 일반 사용자에게 적합합니다.
- Users can upload logs through the web interface, and then share report with others (bulk upload is supported using the upload_log.py script)
- 대화형 플롯.
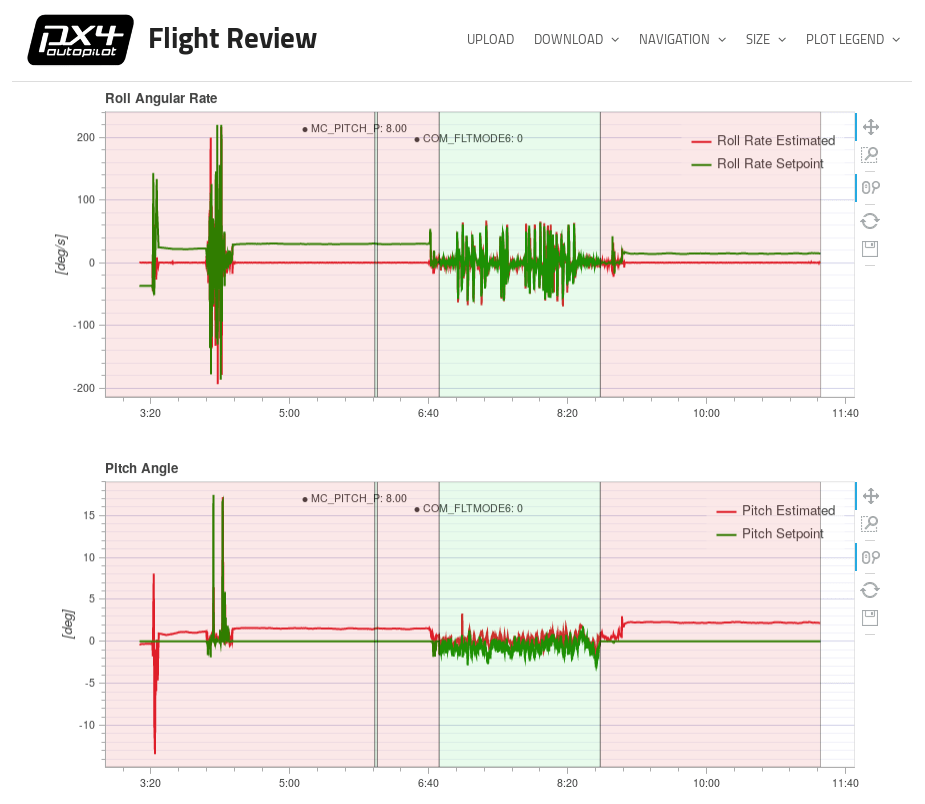
See Log Analysis using Flight Review for an introduction.
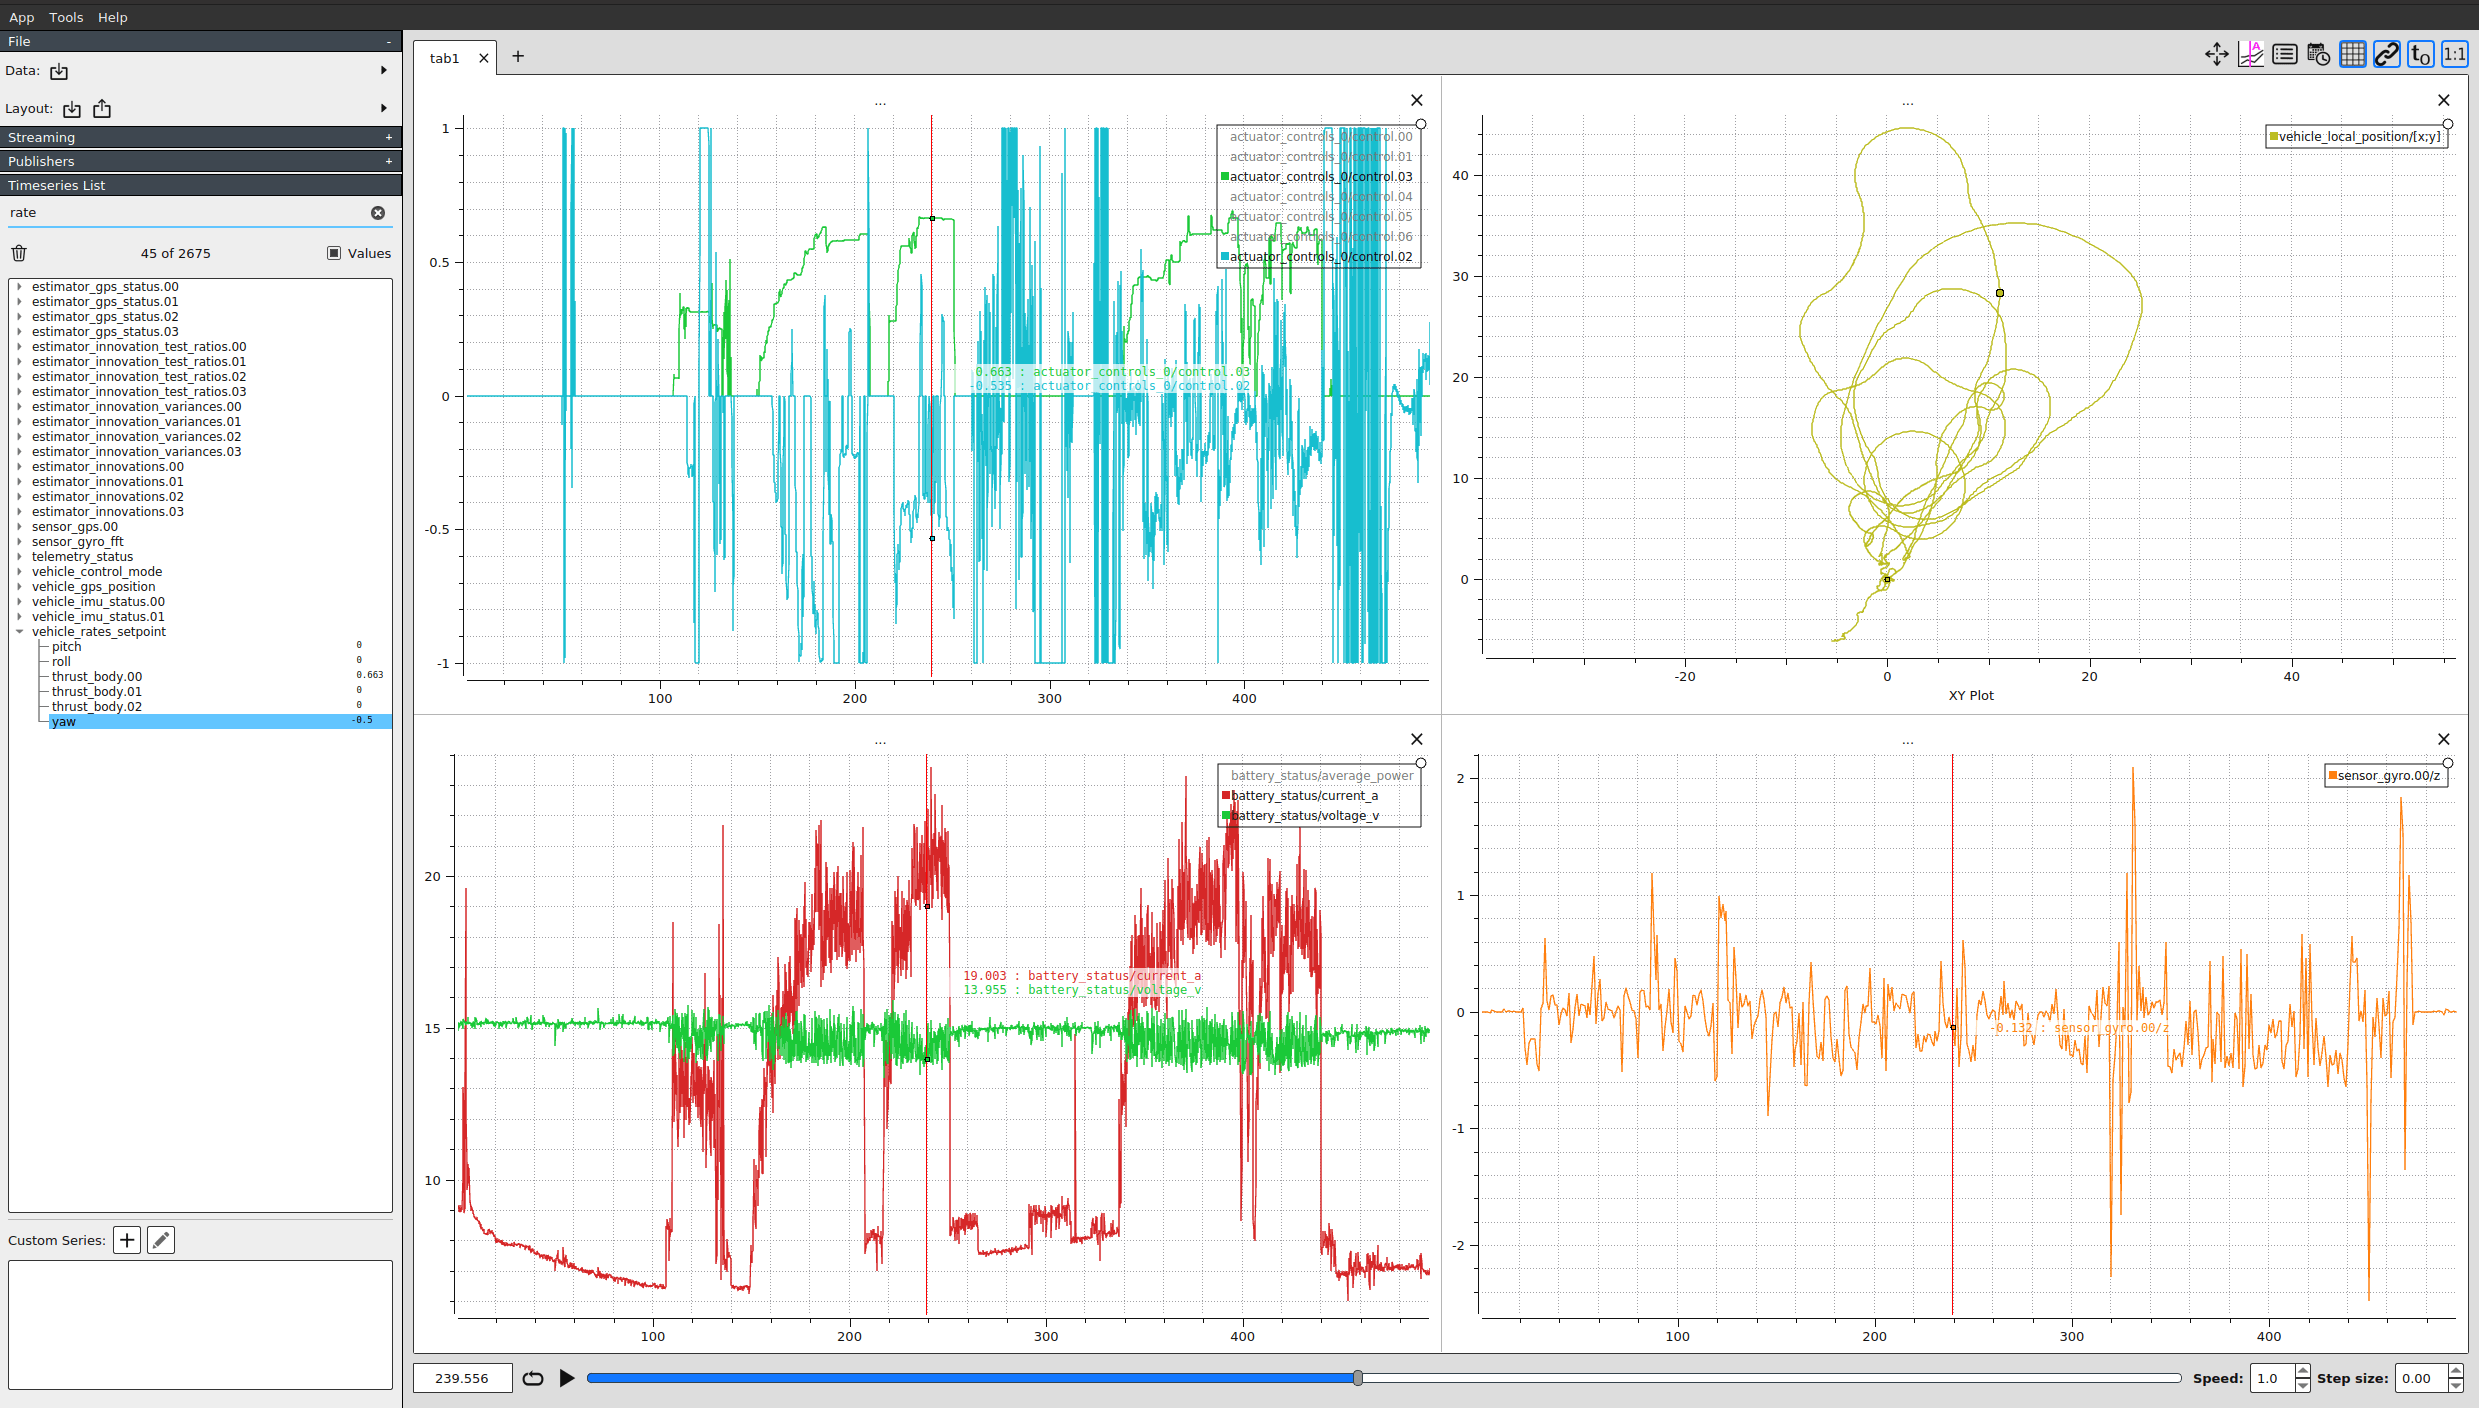
PlotJuggler
PlotJuggler is a desktop application that allows users to easily visualize and analyze data expressed in the form of time series. This is one of the best ULog analysis tools as it exposes all information in the log (Flight Review, by comparison, only shows a small subset of the data).
It supports ULog files (.ulg) since version 2.1.4.
주요 기능:
- Intuitive drag & drop interface.
- 여러 플롯, 탭과 창에서 데이터를 정렬합니다.
- All uORB topics are shown and can be graphed.
- 데이터를 정렬 후 "레이아웃" 파일에 저장하고 다시 로드할 수 있습니다.
- Process your data inside PlotJuggler itself, using custom "data transformations".
Source code and downloads are available on Github.
See Log Analysis using Plot Juggler for an introduction.
pyulog
pyulog is a python package to parse ULog files, along with a set of command-line scripts to extract/display ULog information and convert them to other file formats.
주요 기능:
- ULog 파일을 구문 분석하기위한 Python 라이브러리입니다. 다른 여러 ULog 분석 및 시각화 도구에서 사용하는 기본 라이브러리입니다.
- ULog 정보를 추출/표시하는 스크립트 :
- ulog_info: display information from an ULog file.
- ulog_messages: display logged messages from an ULog file.
- ulog_params: extract parameters from an ULog file.
- ULog 파일을 다른 포맷으로 변환하는 스크립트 :
- ulog2csv: convert ULog to (several) CSV files.
- ulog2kml: convert ULog to (several) KML files.
All scripts are installed as system-wide applications (i.e. they be called on the command line - provided Python is installed), and support the -h flag for getting usage instructions. 예:
sh
$ ulog_info -h
usage: ulog_info [-h] [-v] file.ulg

ULog 파일의 정보 표시

위치 인수 :
  file.ulg       ULog input file

선택적 인수 :
  -h, --help    이 도움말 메시지를 표시하고 종료
  -v, --verbose 자세한 출력
Below we see the kind of information exported from a sample file using ulog_info.
sh
$ ulog_info sample.ulg
Logging start time: 0:01:52, duration: 0:01:08
Dropouts: count: 4, total duration: 0.1 s, max: 62 ms, mean: 29 ms
Info Messages:
sys_name: PX4
time_ref_utc: 0
ver_hw: AUAV_X21
ver_sw: fd483321a5cf50ead91164356d15aa474643aa73
Name (multi id, message size in bytes) number of data points, total bytes
actuator_controls_0 (0, 48) 3269 156912
actuator_outputs (0, 76) 1311 99636
commander_state (0, 9) 678 6102
control_state (0, 122) 3268 398696
cpuload (0, 16) 69 1104
ekf2_innovations (0, 140) 3271 457940
estimator_status (0, 309) 1311 405099
sensor_combined (0, 72) 17070 1229040
sensor_preflight (0, 16) 17072 273152
telemetry_status (0, 36) 70 2520
vehicle_attitude (0, 36) 6461 232596
vehicle_attitude_setpoint (0, 55) 3272 179960
vehicle_local_position (0, 123) 678 83394
vehicle_rates_setpoint (0, 24) 6448 154752
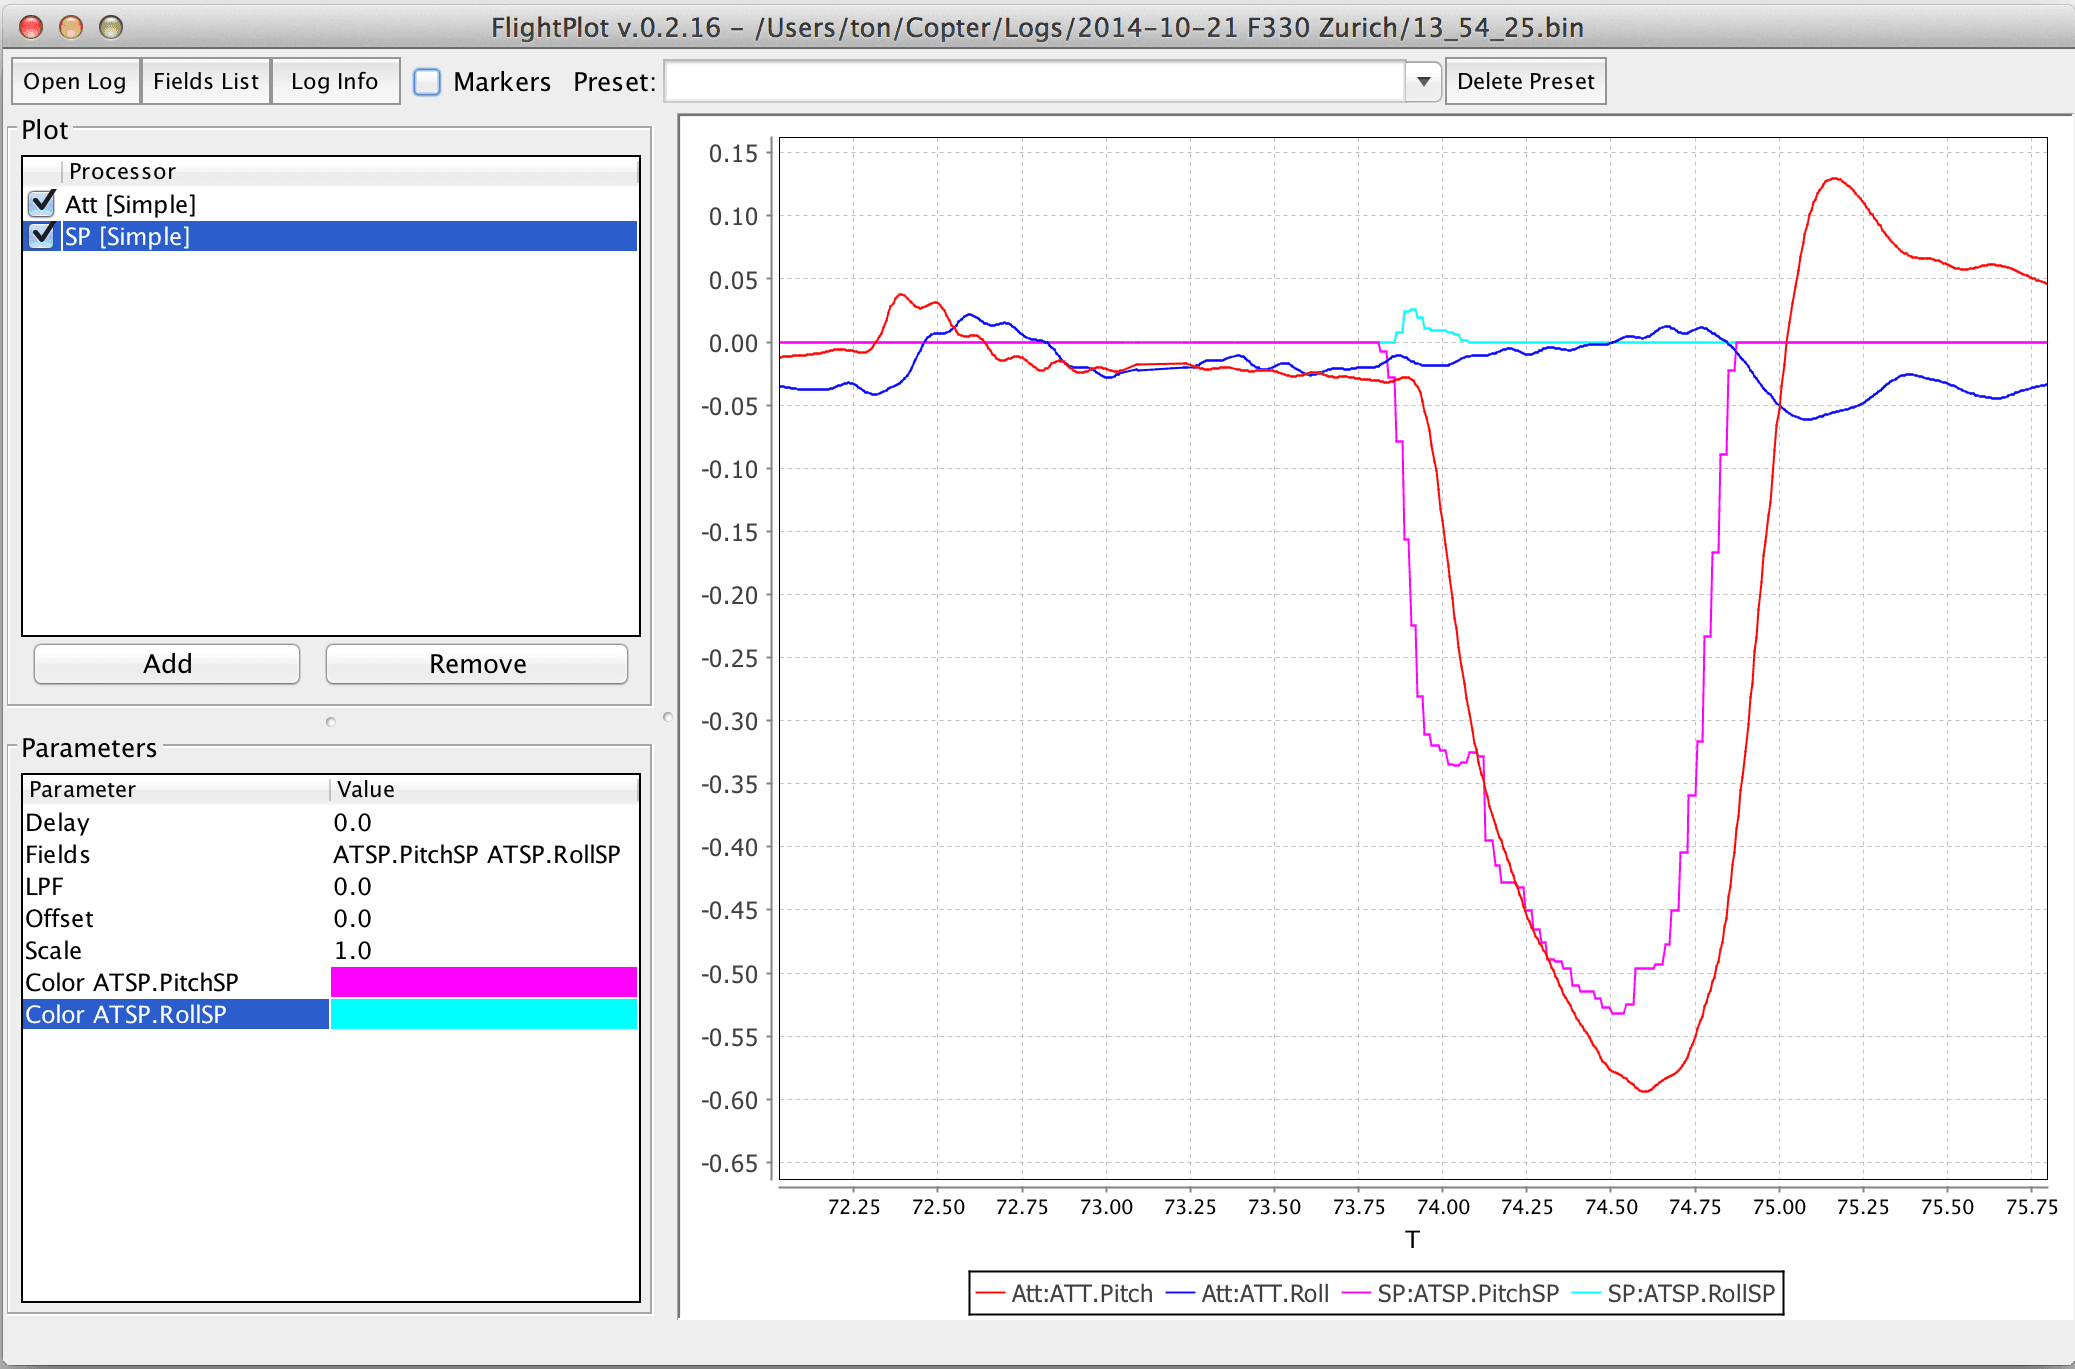
vehicle_status (0, 45) 294 13230FlightPlot
FlightPlot is a desktop based tool for log analysis. It can be downloaded from FlightPlot Downloads (Linux, MacOS, Windows).
주요 기능:
- Java 기반, 다양한 플랫폼 지원.
- 직관적인 GUI, 프로그래밍 지식이 필요하지 않습니다.
- 신규 및 기존 PX4 로그 형식 (.ulg, .px4log, .bin) 모두 지원
- 그래프를 이미지로 저장할 수 있습니다.
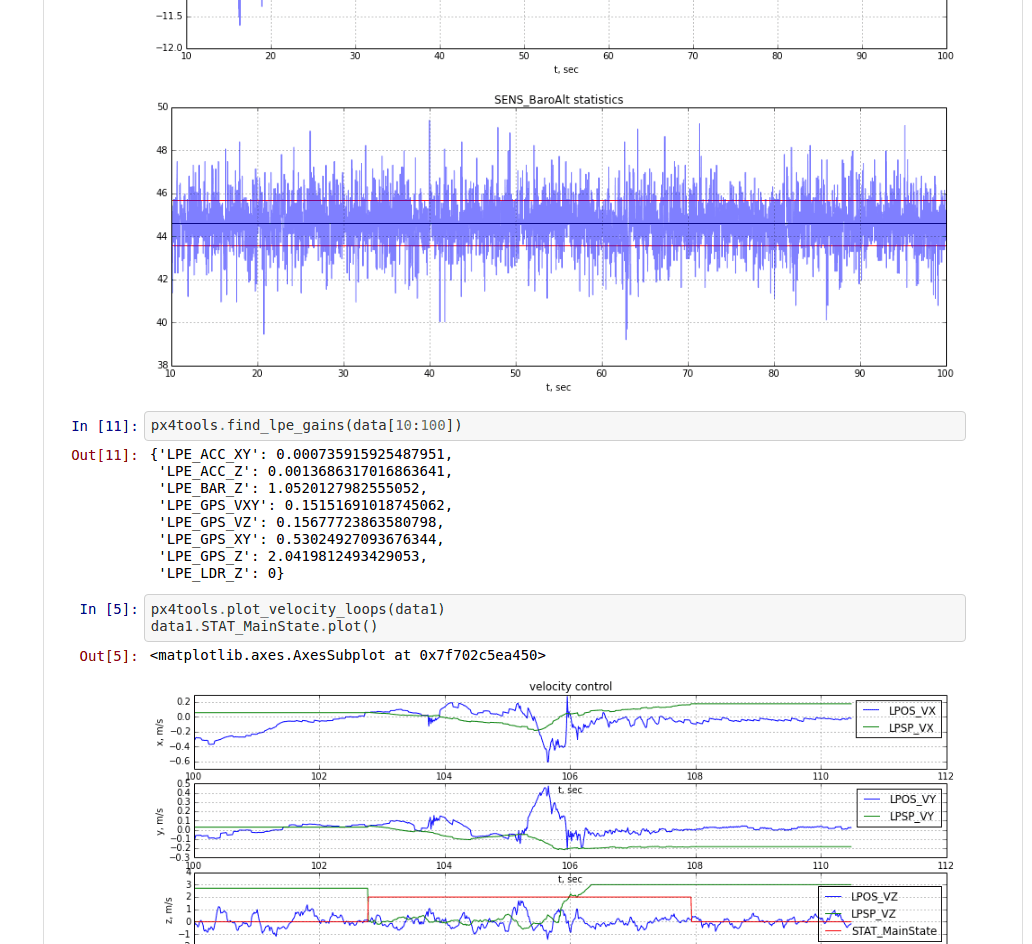
PX4Tools
PX4Tools is a log analysis toolbox for the PX4 autopilot written in Python. The recommended installation procedure is to use anaconda3. See px4tools github page for details.
주요 기능:
- Easy to share, users can view notebooks on Github (e.g. 15-09-30 Kabir Log.ipynb)
- Python based, cross platform, works with anaconda 2 and anaconda3
- iPython/jupyter 노트북을 사용하여 분석과 공유가 편리합니다.
- 상세한 분석이 가능한 고급 플로팅 기능
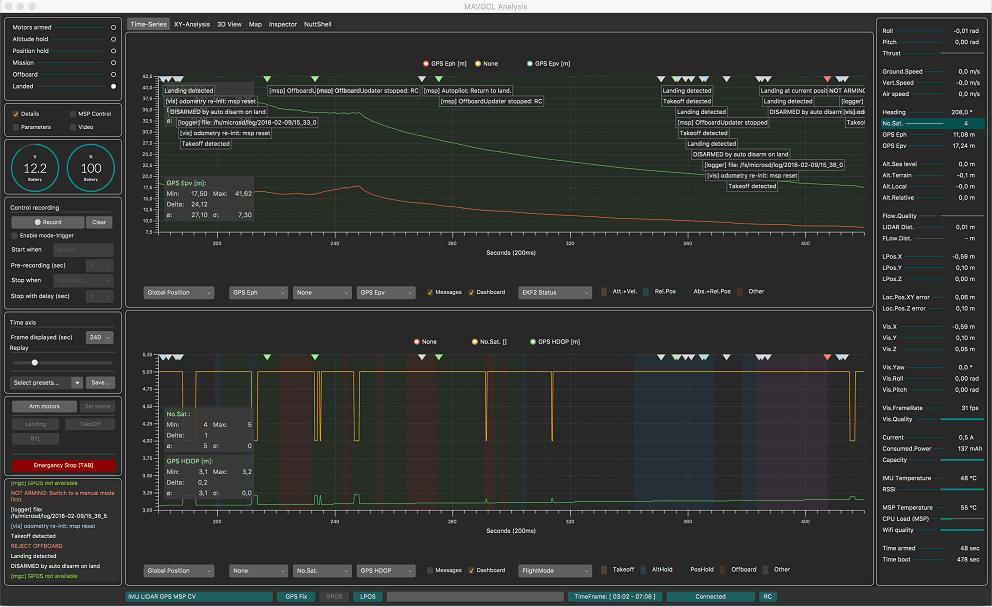
MAVGCL
MAVGCL is an in-flight log analyzer for PX4. 다운로드한 uLog 파일로 오프라인 모드에서도 사용 가능합니다.
주요 기능:
- MAVLink 메시지 또는 MAVLink를 통한 ULOG 데이터에 기반한 실시간 데이터 수집 (50ms 샘플링, 100ms 롤링 디스플레이)
- 메시지 (MAVLink 및 ULog) 및 매개 변수 변경 (MAVLink 전용)으로 주석이 추가 된 타임 차트
- 선택한 주요 수치에 대한 XY 분석
- 3D보기(차량 및 관찰자 관점)
- MAVLink 검사기 (원시 MAVLink 메시지 보고)
- 오프라인 모드 : PX4Log / ULog에서 키 그림 가져오기 (WiFi를 통해 장치에서 파일 또는 마지막 로그)
- Java 기반. macOS 및 Ubuntu에서 작동하는 것으로 알려져 있습니다.
- 그리고 더 많은 기능들 ...
Data Comets
Data Comets is a interactive PX4 flight log analysis tool that allows you to encode flight data onto the flight path, filter and brush the data by time - and much more!
You can use the online version of the tool for small log files (< 32Mb), or run it locally in order to analyze longer flights.